
|
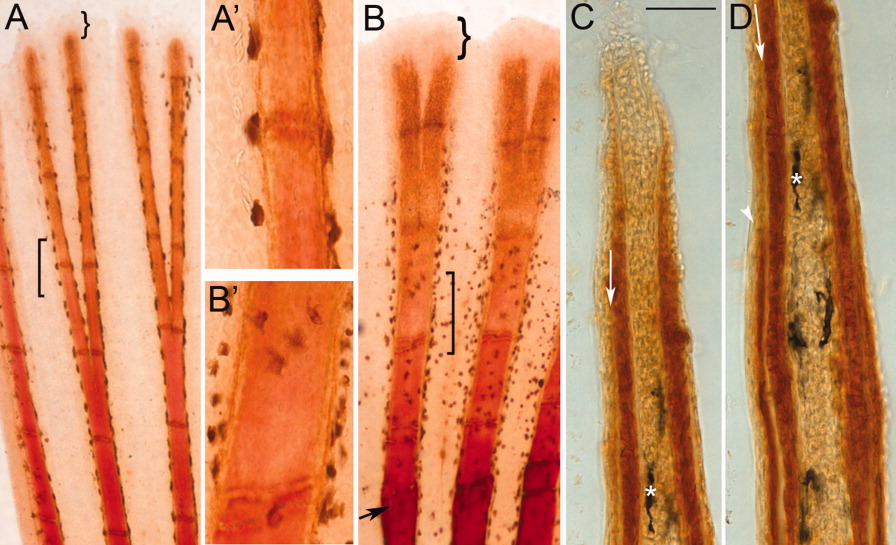
Fig. 1 Differences in the maturity of bone matrix can be detected using alizarin red. A: Ontogenetic fin stained for both alizarin red and ZNS5. Square bracket identifies transition from the alizarin red-positive staining (proximally) to the alizarin red-negative region (A′ shows this in higher magnification). B: Regenerating fin (5 dpa) stained for both alizarin red and ZNS5. Arrow points to amputation plane. Square bracket identifies transition from the alizarin red-positive staining (proximally) to the alizarin red-negative region (B′ shows this in higher magnification). Curved brackets in A and B identify the ZNS5-negative region (the remainder of the fin ray is ZNS5-positive). C, D: Sequential images of a single longitudinal cryosection through a ZNS5-stained fin ray (i.e., staining was completed on whole mount fins prior to sectioning). Arrow points to unstained bone matrix. Asterisk identifies a landmark melanocyte. Arrowhead in D points to ZNS5-positive signal on the lateral surface of the bone matrix (signal can also be observed medial to the bone matrix). Scale bar for C and D = 50 μm.