
Fig. 4
- ID
- ZDB-IMAGE-090826-1
- Publication
- Petko et al., 2009 - Proteomic and functional analysis of NCS-1 binding proteins reveals novel signaling pathways required for inner ear development in zebrafish
- All Figures
- Figures for Petko et al., 2009
|
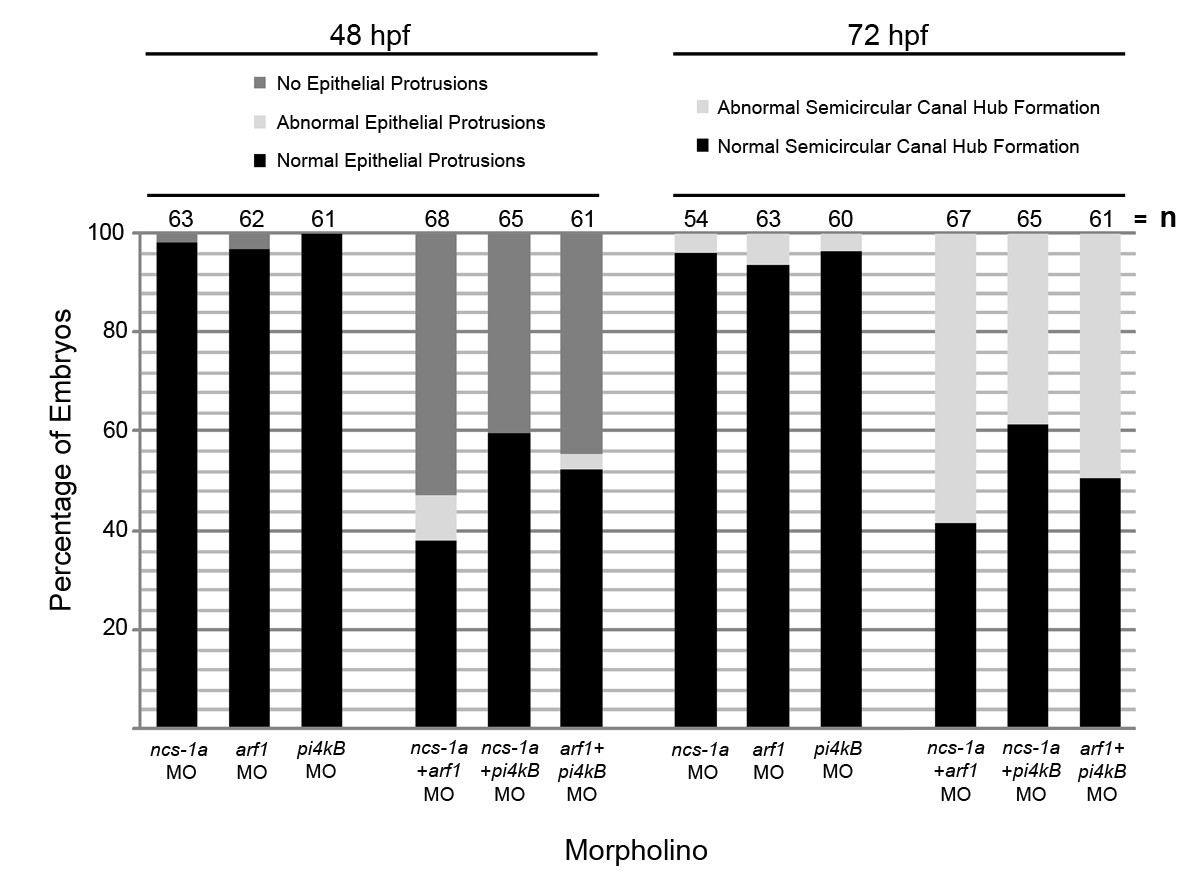
Fig. 4 Phenotypes of embryos co-injected with subeffective doses of NBP MOs. Bar graph depicts percent of fish at 48 hpf or 72 hpf that displayed normal epithelial protrusions or semicircular canal hub formation, abnormal epithelial protrusions or semicircular canal hub formation, or absence of epithelial protrusions. Embryos were injected with 0.5 ng of ncs-1a-ATG MO alone, 0.5 ng of arf1-UTR MO alone, or 2 ng of pi4kβ-ATG MO alone. Alternatively, embryos were co-injected with 0.5 ng of ncs-1a-ATG MO plus 0.5 ng of arf1-UTR MO, 0.5 ng of ncs-1a-ATG MO plus 2 ng of pi4kβ-ATG MO, or 0.5 ng arf1-UTR plus 2 ng pi4kβ-ATG MO. The number of fish assayed for each treatment is displayed above the bars.