
|
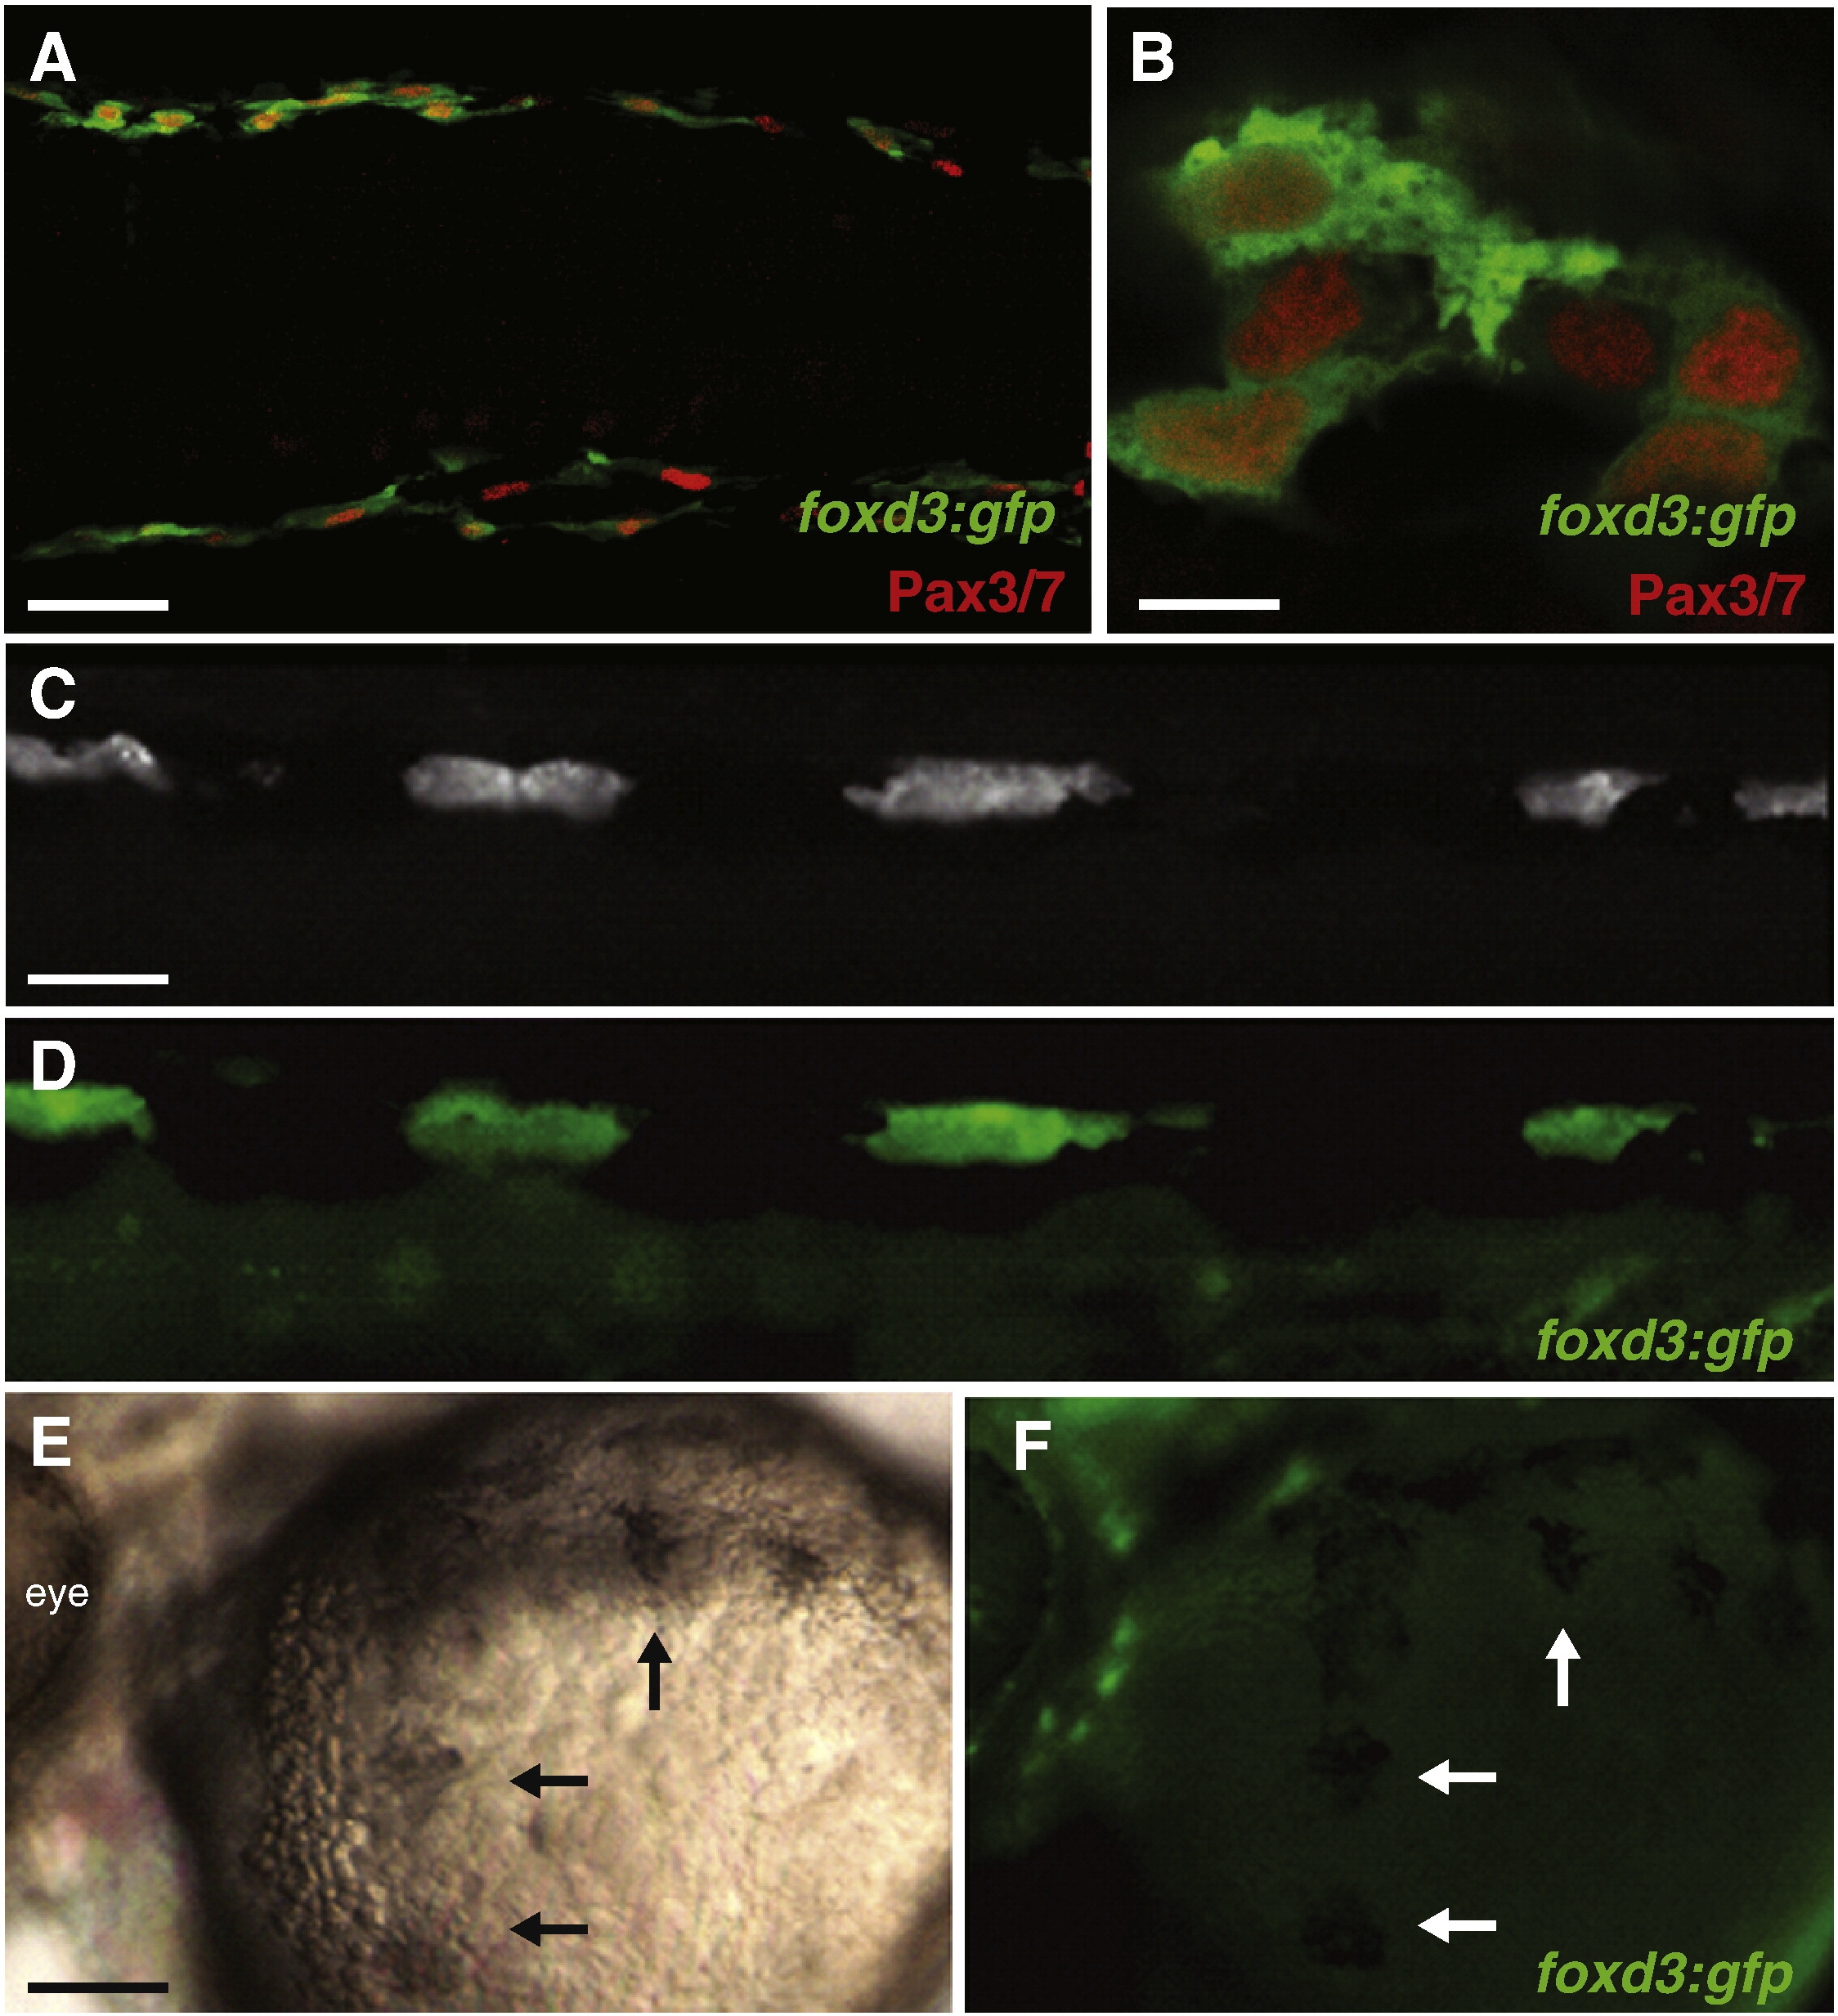
Fig. 4 foxd3 expression is absent in melanophores, but present in iridophores and xanthophore precursors. (A, B) foxd3:gfp maintains expression in xanthoblasts, 27 hpf, dorsal view, anterior left. Green: anti-GFP, red: Pax3/7 (mouse DP312 Ab). 94% of Pax3/7 xanthoblasts (n = 165) are foxd3:gfp positive. (A) 20x, scale bar = 40 μm. (B) 40x, scale bar = 7.5 μm. (C, D) foxd3:gfp maintains expression in iridophores, 72 hpf, lateral view, dorsal stripe, anterior left. Scale bar = 25 μm. 88.3% of differentiated iridophores (n = 342) are foxd3:gfp positive. (C) Incident light reveals 4 iridophores. (D) Green: live foxd3:gfp. (E, F) foxd3:gfp expression absent in melanophores, 72 hpf, lateral view, yolk ball, anterior left, embryo treated with PTU. Arrows: partially melanized melanophores, scale bar = 90 μm. 5% of melanophores (n = 314) express foxd3:gfp. (E) Brightfield. (F) Green: live foxd3:gfp.
Reprinted from Developmental Biology, 332(2), Curran, K., Raible, D.W., and Lister, J.A., Foxd3 Controls Melanophore Specification in the Zebrafish Neural Crest by Regulation of Mitf, 408-417, Copyright (2009) with permission from Elsevier. Full text @ Dev. Biol.