
Fig. 5
- ID
- ZDB-IMAGE-090717-18
- Publication
- Lamont et al., 2009 - Antagonistic interactions among Plexins regulate the timing of intersegmental vessel formation
- All Figures
- Figures for Lamont et al., 2009
|
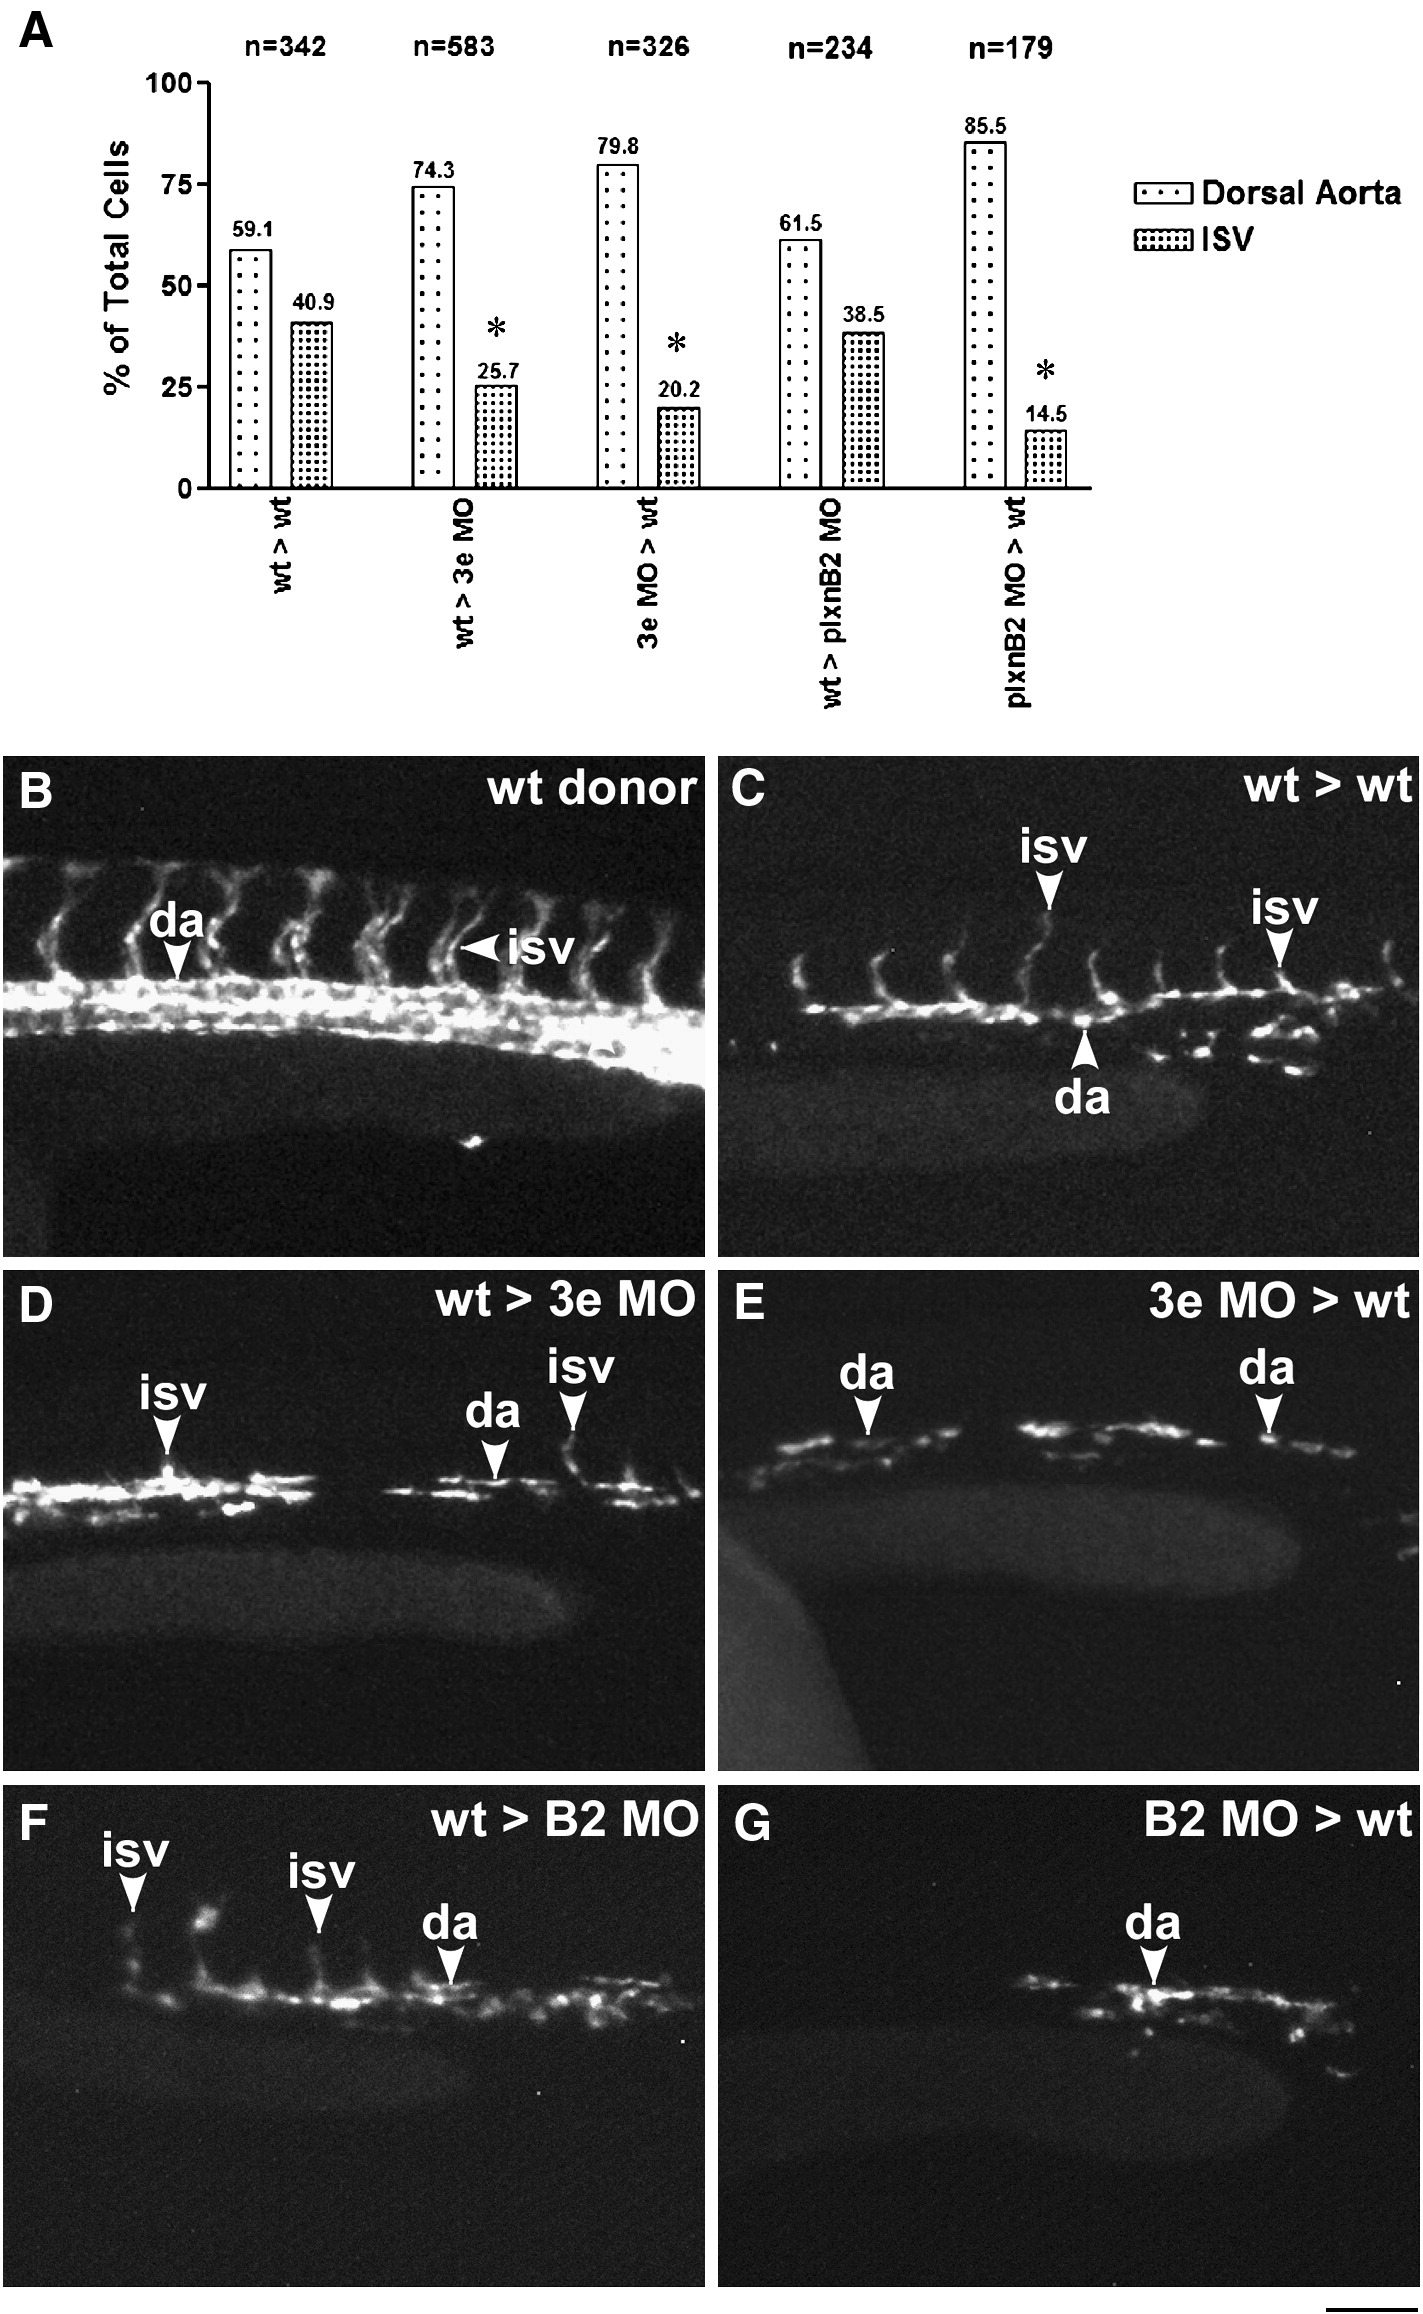
Fig. 5 Sema3e acts both autonomously and non-autonomously in angioblasts while PlxnB2 acts autonomously. (A) Summary of the total proportion of cell types observed after transplantation given as a percentage of total cells counted. (B–E) Representative images of a Tg(kdr:GFP)la116 wild type donor embryo (B), recipient embryo from a wt > wt transplantation (C), recipient embryo from a wt > 3e MO transplantation (D), recipient embryo from a 3e MO > wt transplantation (E), recipient from a wt > plxnB2 MO transplantation (F), and recipient from a plxnB2 MO > wt transplantation (G). Arrows indicate cells classified as dorsal aorta (da), ISV cells (ISV). * denotes a probability of difference from wild type by Chi-square test of < 0.002. Scale bar is 100 μm.
Reprinted from Developmental Biology, 331(2), Lamont, R.E., Lamont, E.J., and Childs, S.J., Antagonistic interactions among Plexins regulate the timing of intersegmental vessel formation, 199-209, Copyright (2009) with permission from Elsevier. Full text @ Dev. Biol.