
|
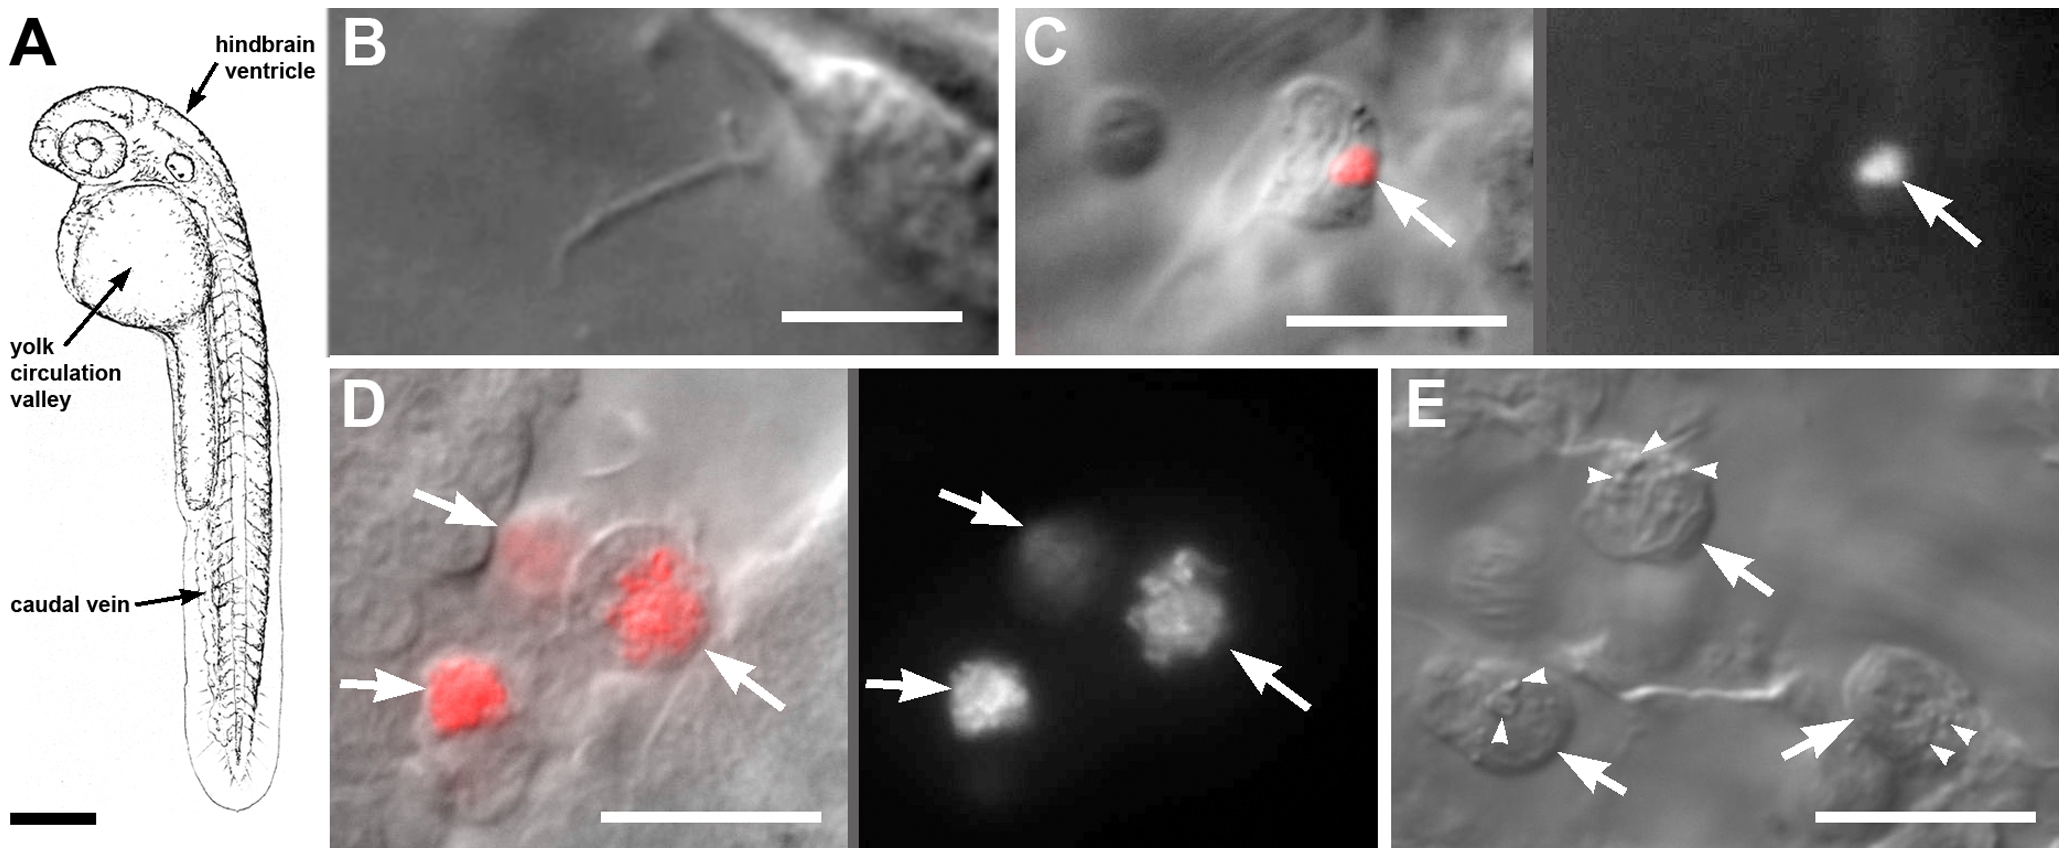
Fig. 1 Cellular details of early phagocyte-leptospire interactions.
A. Schematic view of 36hpf zebrafish embryo, with injection and observation sites indicted. Scale bar, 300 μm. B. Phagocyte containing leptrospires within two hours of intravenous infection. Left, DIC overlay; right, SYTO 83 fluorescence. C. Single leptospire visible by DIC microscopy shortly after injection. See also Video S1. D. Phagocytes containing large numbers of leptospires four hours after injection into hindbrain ventricle. Left, DIC overlay; right, SYTO 83 fluorescence. E. Phagocytes (arrows) containing leptospires also acquired numerous small cytoplasmic vesicles (arrowheads). See Video S2. All scale bars 20 μm unless noted otherwise.