
Fig. 1
- ID
- ZDB-IMAGE-090617-1
- Genes
- Publication
- Zhao et al., 2009 - Distinct expression of two foxg1 paralogues in zebrafish
- All Figures
- Figures for Zhao et al., 2009
|
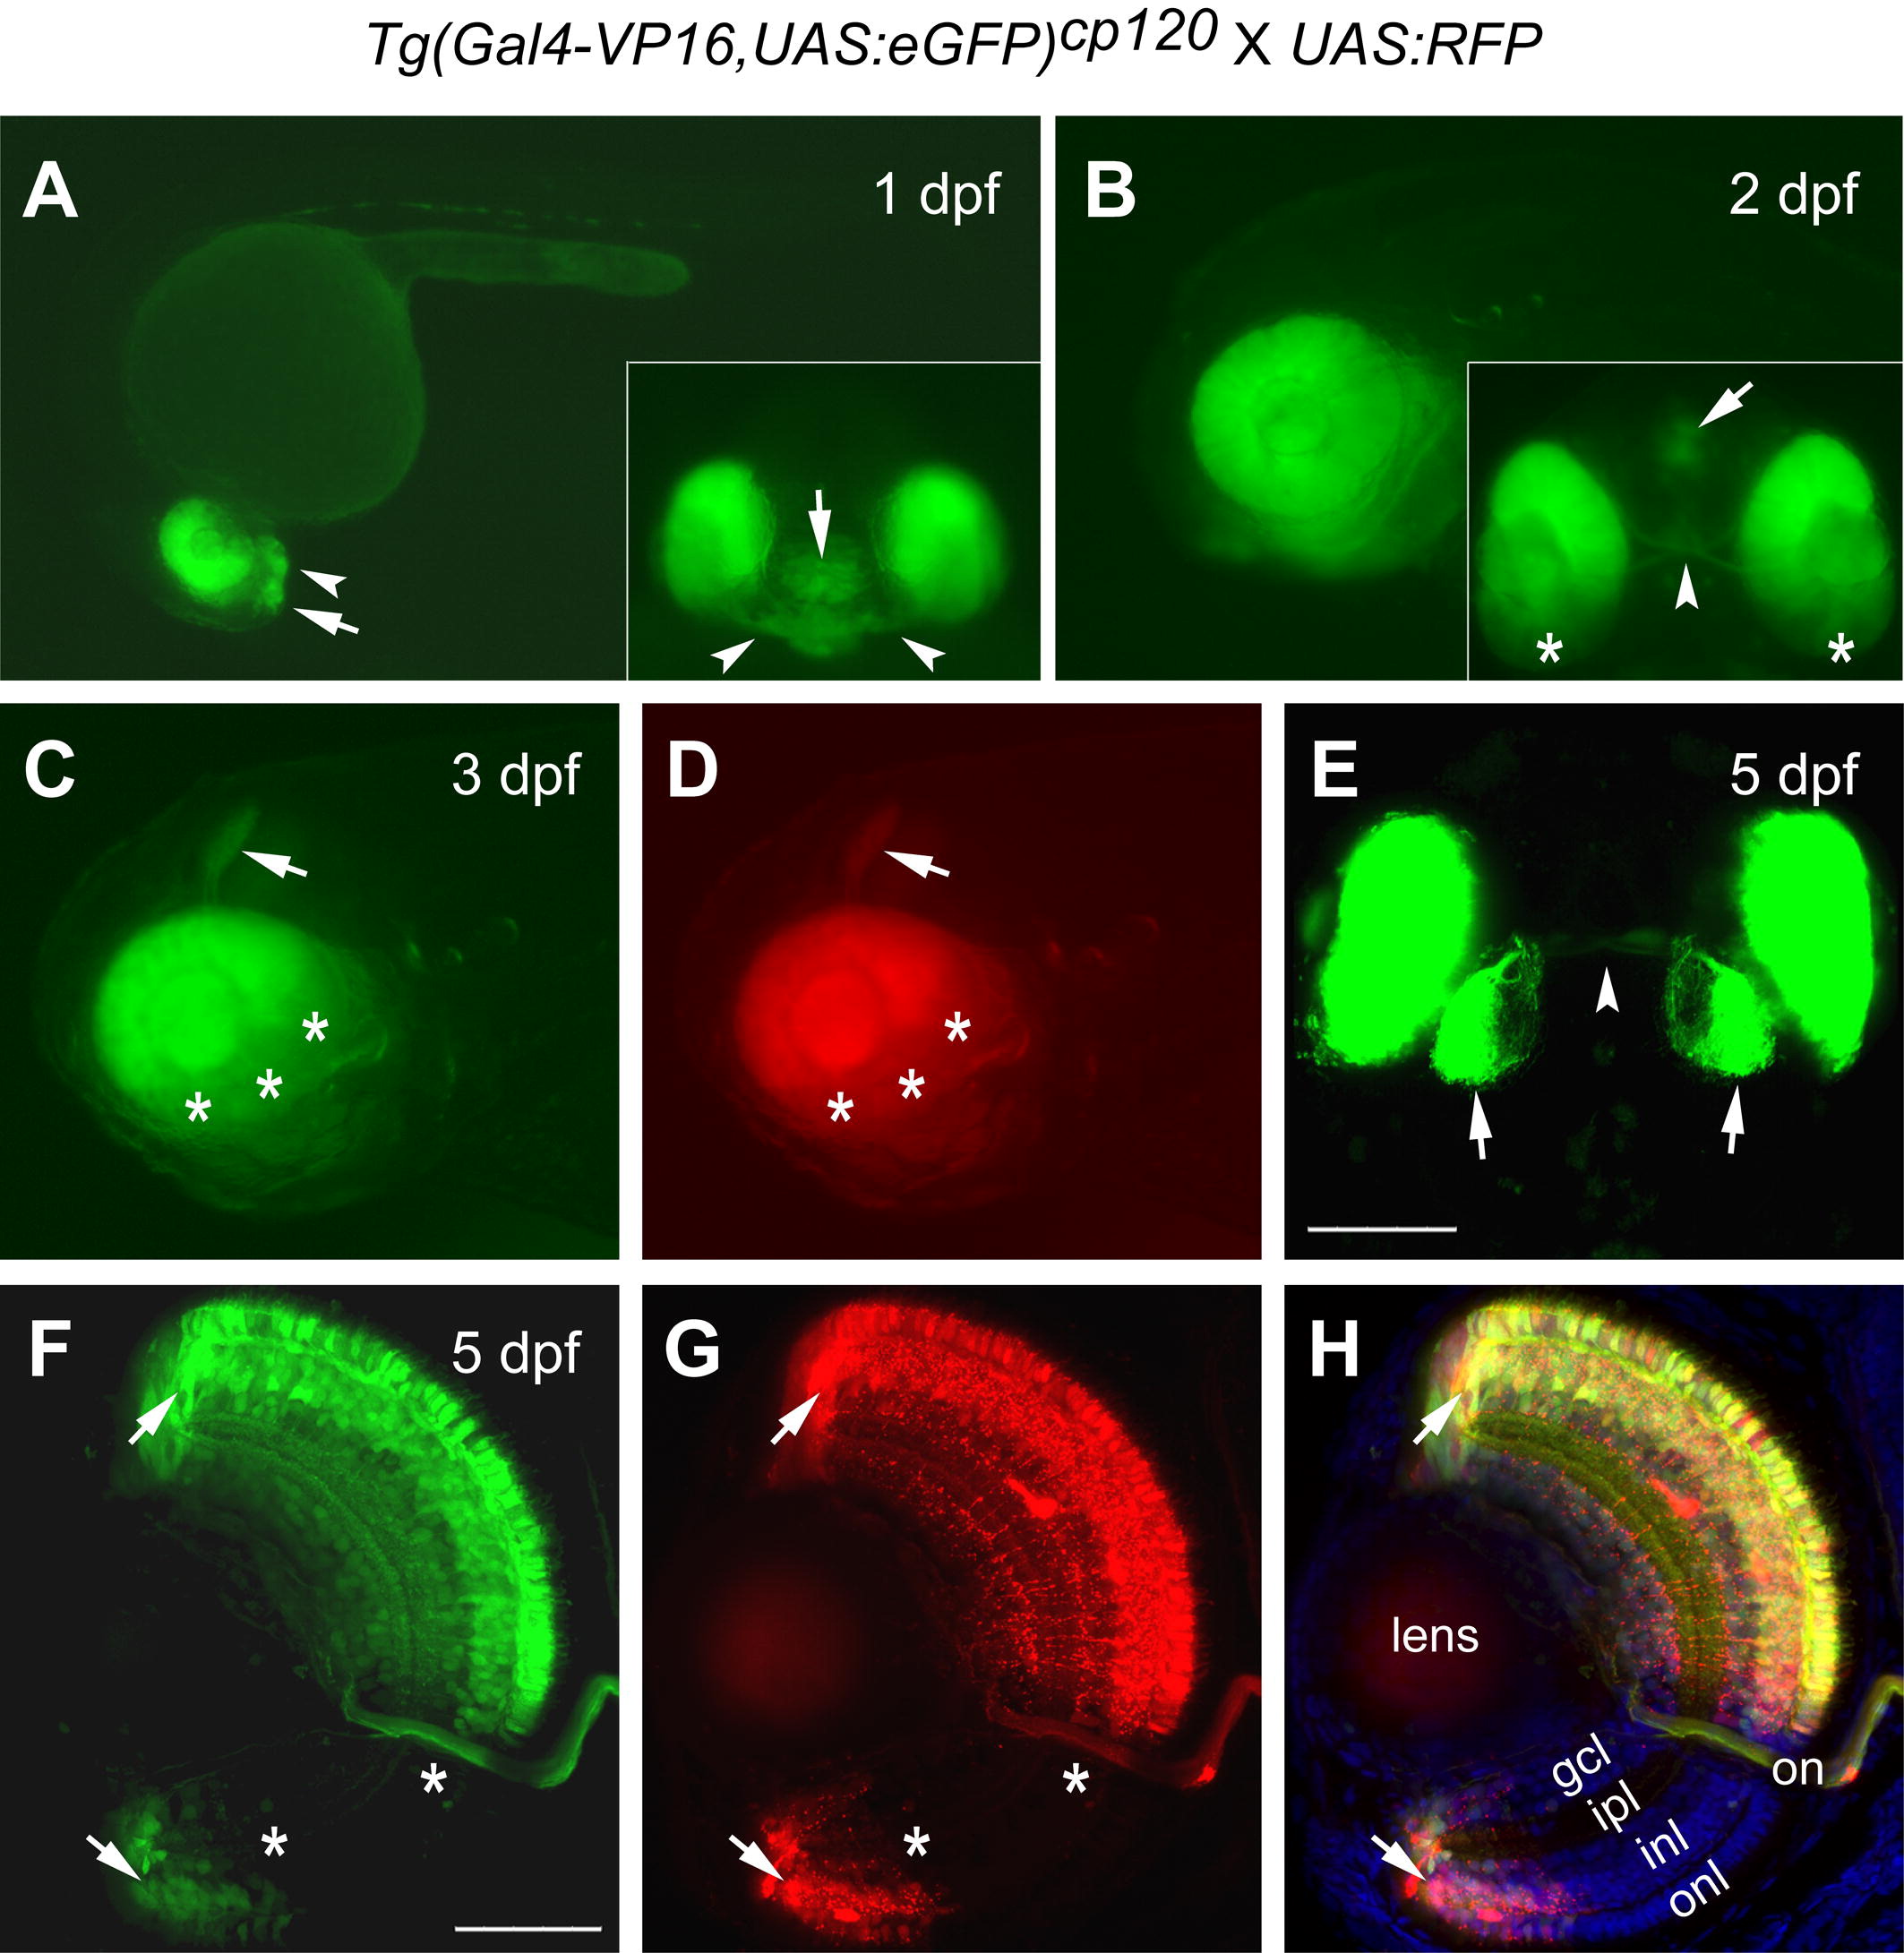
Fig. 1 Fluorescence expression profile of the enhancer trap line Tg(Gal4-VP16,UAS:eGFP)cp120 and its ability to induce expression of a UAS:RFP transgene. Expression of eGFP and RFP was analyzed in offspring from a cross between the enhancer trap line and transgenic UAS:RFP fish. (A) A lateral view at 1 dpf shows eGFP expression mainly in retina, optic stalk (arrowhead) and ventral telencephalon (arrow). The inset is a front view of the same embryo. (B) Expression of eGFP is maintained in the retina at a later stage (2 dpf). The ventral view in the inset shows eGFP labeling of the optic nerve (arrowhead), restricted area of the forebrain (arrow), and lower level in the posterior retina (stars). (C and D) Close up views of the fluorescence detected in dorsal-nasal retina and tectum (arrow) at 3 dpf. Ventral and posterior retina show no expression (stars). RFP is transactivated under control of the UAS element and shows the same pattern as eGFP. (E) Confocal image, viewed from the dorsal side, showing eGFP labeling in the tectum (arrows) and optic nerve (arrowhead). (F–H) Confocal images of a cryosection (dorsal at the top) show the co-localization of eGFP and RFP. Both the dorsal and ventral CMZ were labeled with fluorescence (arrows). An area in the ventral retina showing no fluorescence is marked (stars). Merged image of (F) and (G), along with DAPI stained nuclei is shown in (H). The different stages are indicated. The orientation is with anterior to the left (A–D). Abbreviations: dpf, days post-fertilization; gcl, ganglion cell layer; ipl, inner plexiform layer; inl, inner nuclear layer; onl, outer nuclear layer; on, optic nerve. Scale bars: 100 μm (E); 50 μm (F–H).
Reprinted from Gene expression patterns : GEP, 9(5), Zhao, X.F., Suh, C.S., Prat, C.R., Ellingsen, S., and Fjose, A., Distinct expression of two foxg1 paralogues in zebrafish, 266-272, Copyright (2009) with permission from Elsevier. Full text @ Gene Expr. Patterns