
|
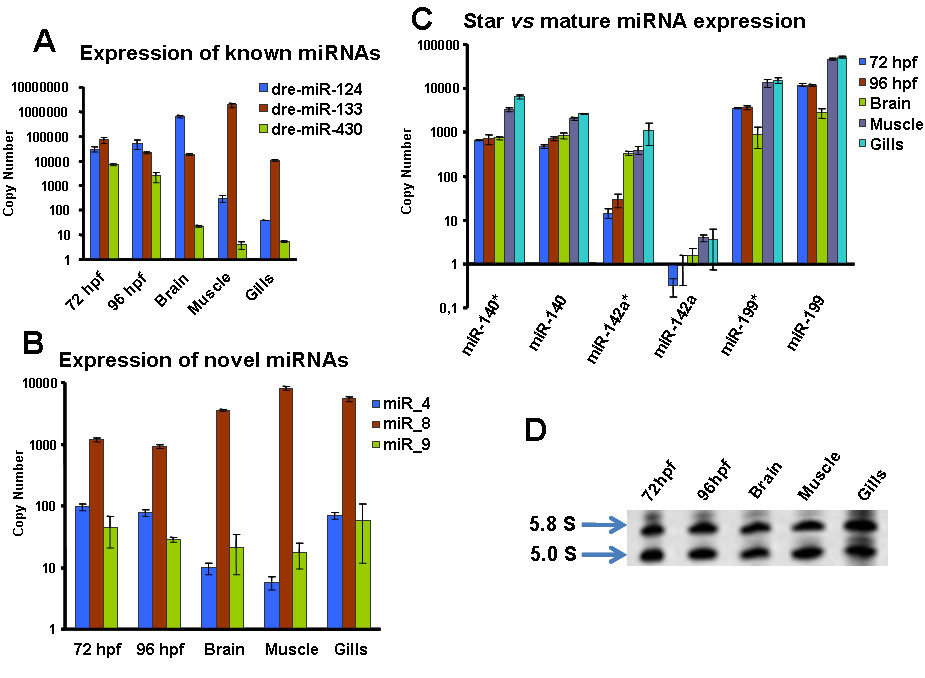
Fig. 5 qRT-PCR analysis of miRNA expression. A) Expression of known miRNAs. Dre-miR-124 expression was higher in developmental and brain samples. Dre-miR-133 expression was higher in muscle and dre-miR-430 showed higher expression in developmental samples. B) Expression of novel miRNAs. miR_8 expression was higher in differentiated organs, miR_4 and miR_9 displayed similar expression levels throughout development and in differentiated organs. C) Star vs mature miRNA expression. The expression of dre-miR-140* and dre-miR-199* was similar to that of their respective mature miRNAs. Dre-miR-142* showed significantly higher expression than its mature miRNA, which was not detected during development. D) 5.8 S and 5.0S RNA samples. Denaturing 12% acrylamide gel showing the relative concentration of 5.0S and 5.8S RNA in the samples used in the qRT-PCR.