
IMAGE
Fig. 7
- ID
- ZDB-IMAGE-090506-35
- Publication
- Waxman et al., 2009 - Increased Hox activity mimics the teratogenic effects of excess retinoic acid signaling
- All Figures
- Figures for Waxman et al., 2009
Image
|
Figure Caption
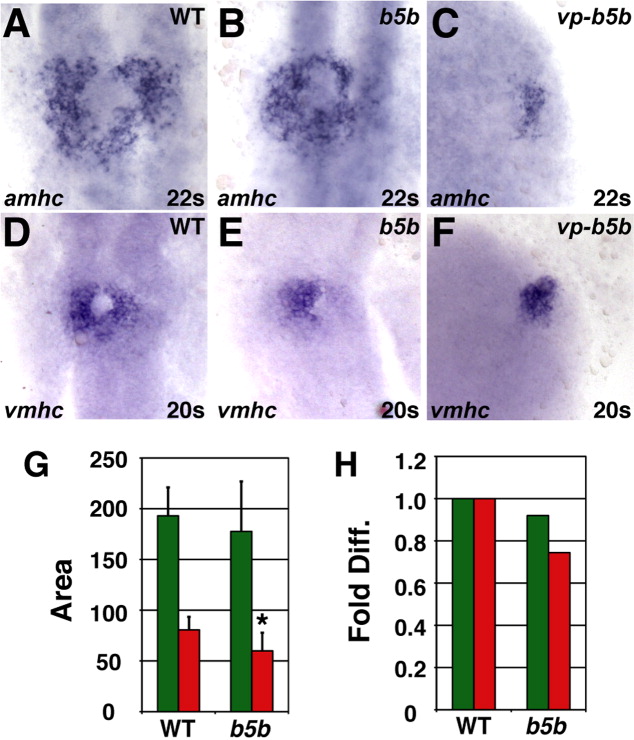
Fig. 7 Increased Hox activity reduces amhc and vmhc expression. A-F: Cardiomyocytes from WT, hoxb5b mRNA-injected (150 pg), and vp-hoxb5b mRNA-injected (60 pg) embryos. G: Mean (±SD) of areas of amhc and vmhc expression. WT amhc, n = 48; hoxb5b mRNA amhc, n = 53; WT vmhc, n = 59; hoxb5b mRNA vmhc, n = 53. H: Fold difference of means in G. Asterisk, statistically significant difference from WT (P < 0.005, Student's t-test). All views and graphs are as presented in Figure 4.
Acknowledgments
This image is the copyrighted work of the attributed author or publisher, and
ZFIN has permission only to display this image to its users.
Additional permissions should be obtained from the applicable author or publisher of the image.
Full text @ Dev. Dyn.