
IMAGE
Fig. 4
- ID
- ZDB-IMAGE-090506-32
- Publication
- Waxman et al., 2009 - Increased Hox activity mimics the teratogenic effects of excess retinoic acid signaling
- All Figures
- Figures for Waxman et al., 2009
Image
|
Figure Caption
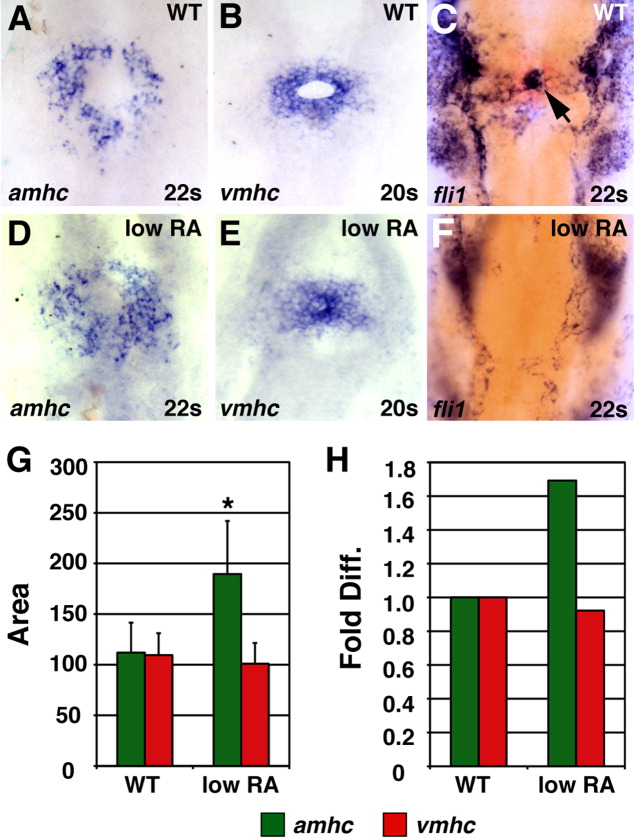
Fig. 4 Low RA treatment can cause an increase in amhc expression. A-F: In situ hybridizations at the 20- or 22-somite stage; dorsal views, anterior up. Arrow in C, endocardial precursors. G: Mean (±SD) of areas of amhc and vmhc expression. WT amhc, n = 43; WT vmhc, n = 31; low RA amhc, n = 18; low RA vmhc, n = 25. H: Fold difference in means in G. Asterisk, statistically significant differences from WT (P < 0.005, Student's t-test).
Acknowledgments
This image is the copyrighted work of the attributed author or publisher, and
ZFIN has permission only to display this image to its users.
Additional permissions should be obtained from the applicable author or publisher of the image.
Full text @ Dev. Dyn.