
Fig. S5
- ID
- ZDB-IMAGE-090421-5
- Publication
- Sakamoto et al., 2009 - Heterochronic shift in Hox-mediated activation of sonic hedgehog leads to morphological changes during fin development
- All Figures
- Figures for Sakamoto et al., 2009
|
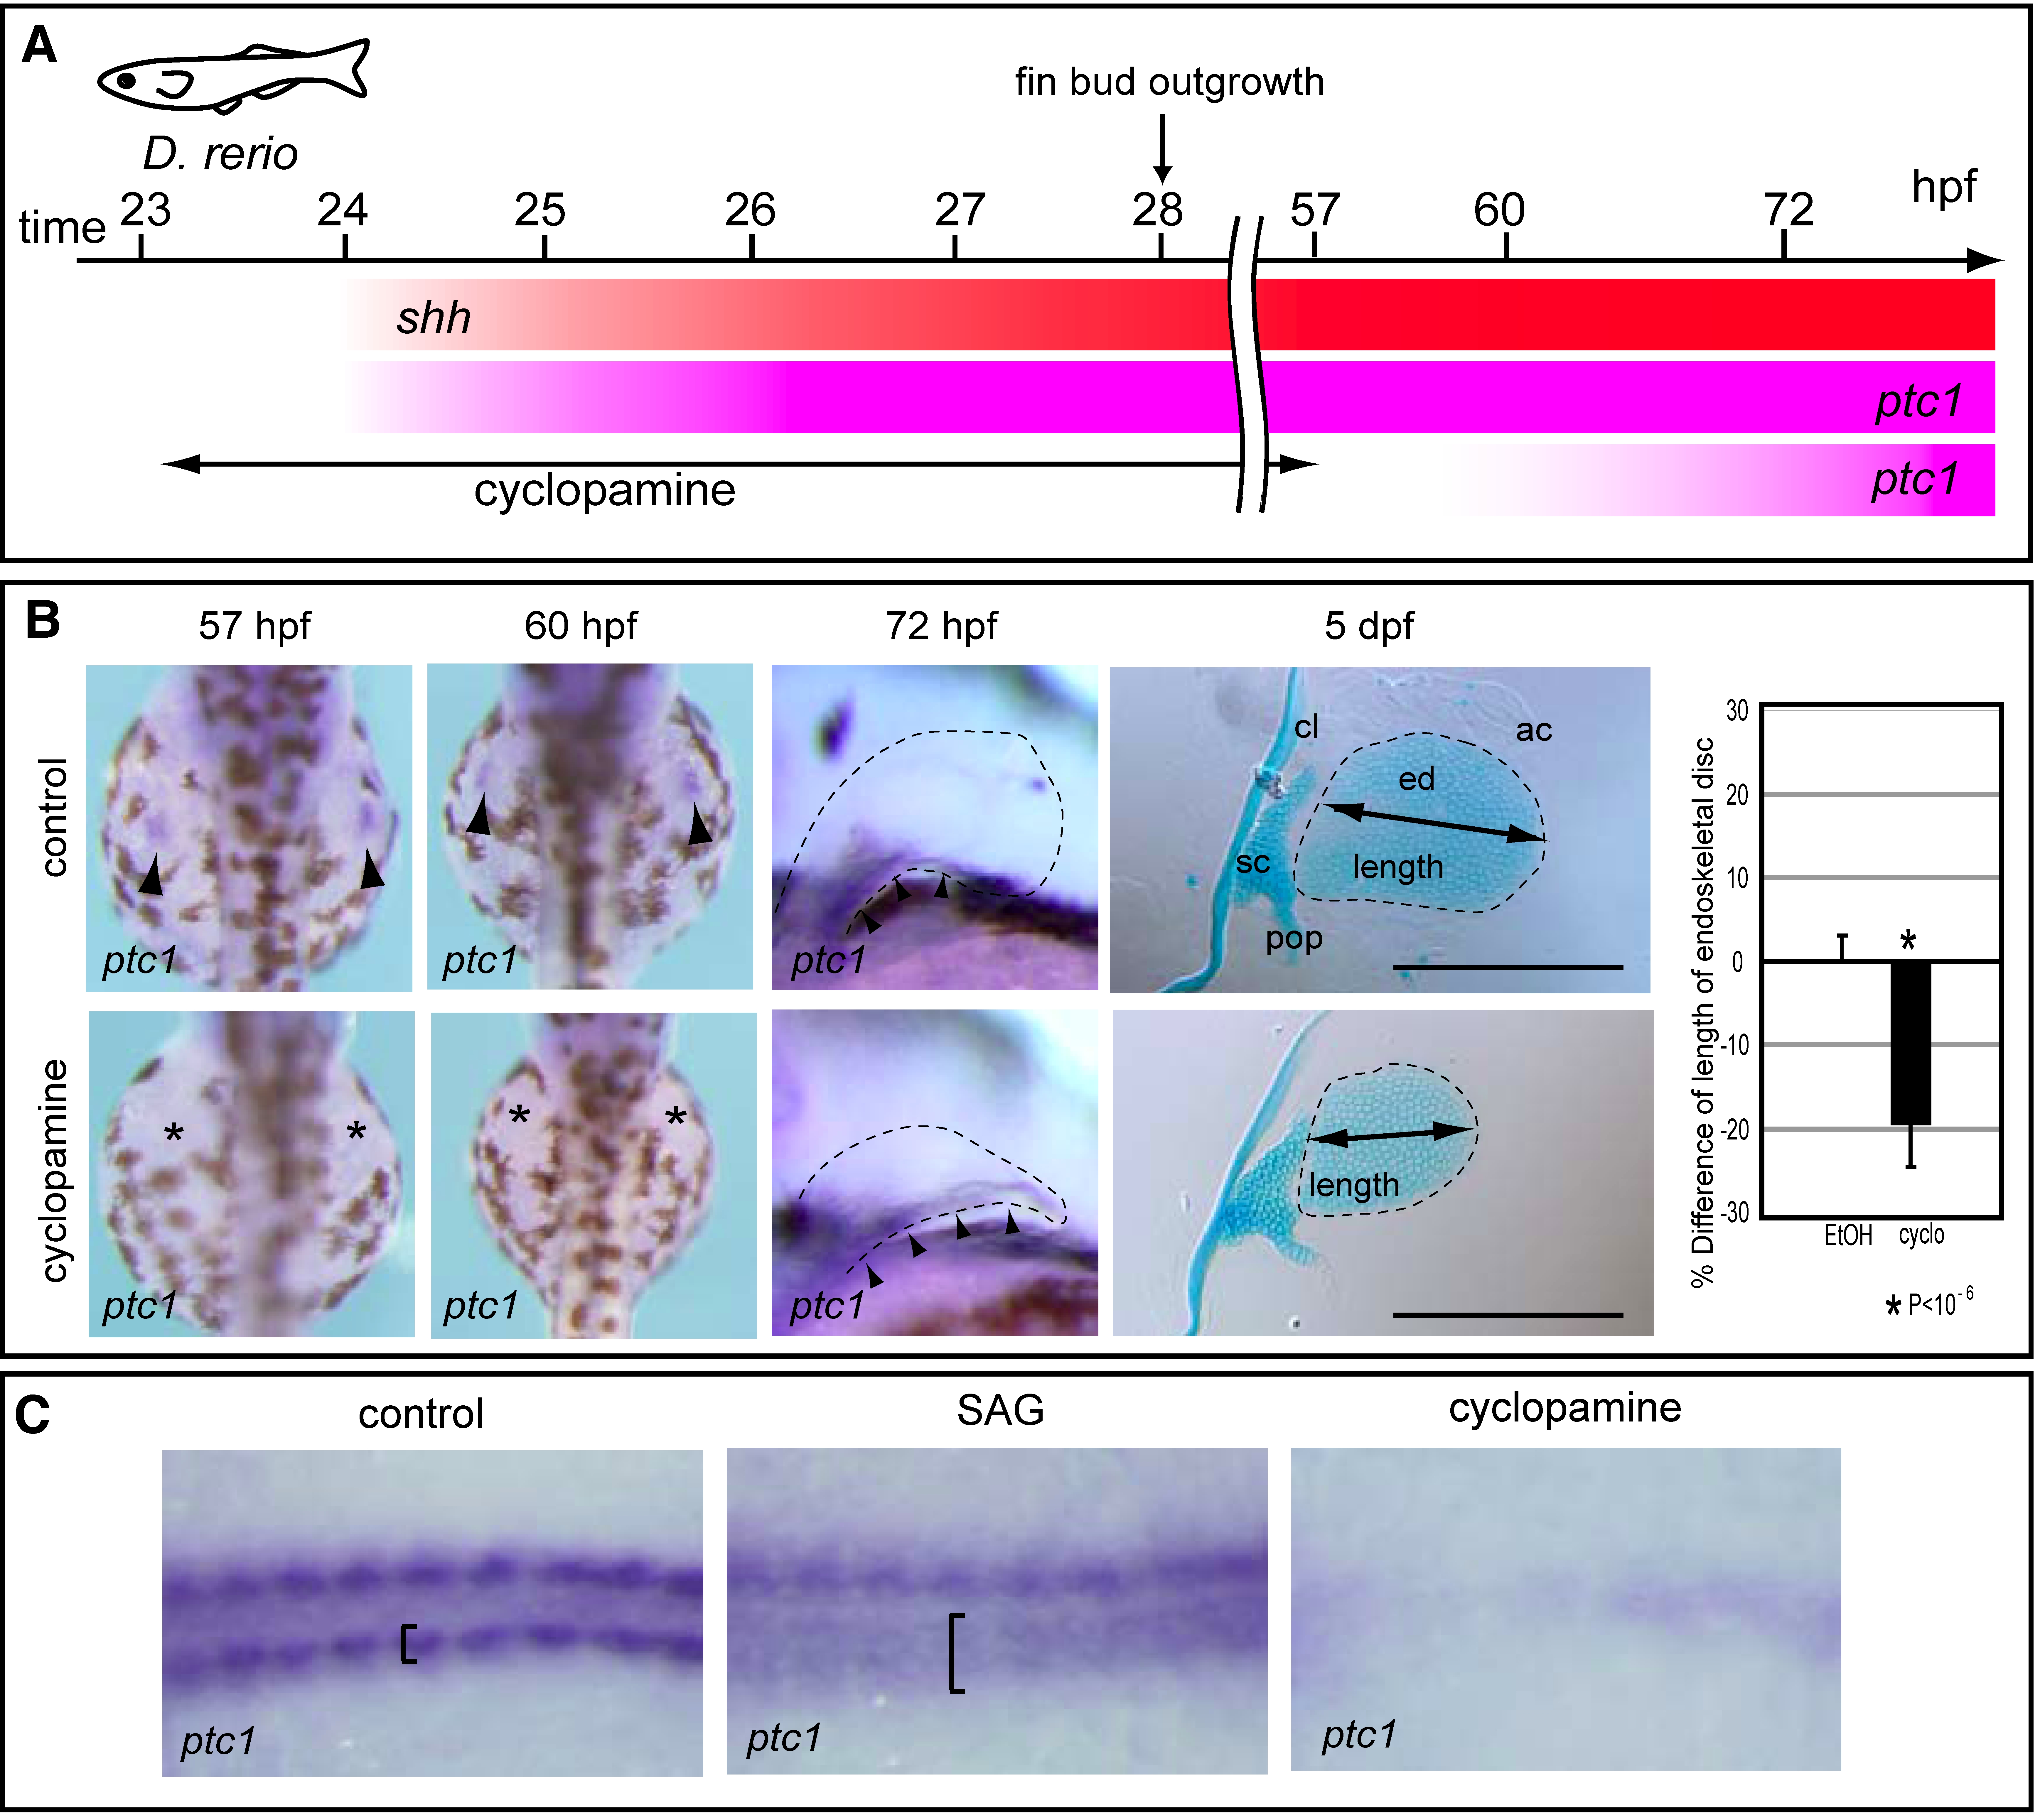
Fig. S5 Treatment of zebrafish embryos with cyclopamine or SAG. (A) Hedgehog signaling was blocked by treatment with 60 μM cyclopamine from 23 to 57 hpf, resulting in ablation of ptc1 expression until at least 60 hpf. ptc1 expression recovered by 72 hpf in pectoral fin primordia of cyclopamine-treated embryos. (B) ptc1 expression was examined in control or cyclopamine-treated embryos at the indicated stages (left). At 5 dpf, pectoral fins of control (n = 7) or cyclopamine-treated embryos (n = 9) were stained with Alcian Blue (middle). The relative lengths of the endoskeletal disc are presented in the graph (right). *P<10-6, as assessed by Student's t-test. Cleithrum (cl), scapulocoracoid (sc), postcoracoid process (pop), endoskeletal disc (ed) and actinotrichs (ac) are indicated. Scale bars: 200 μm. (C) Zebrafish embryos were treated with SAG or cyclopamine, and ptc1 expression was examined in adaxial cells. The specification of adaxial cells is known to depend on Hh signaling [1]. Panels show the dorsal view of ptc1 expression in an 8-somite-stage control embryo (left), in a SAG-treated embryo (middle), and in a cyclopamine-treated embryo (right). In control embryo, adaxial cells are indicated by brackets. Note that ptc1 expression is expanded in the SAG-treated embryo (brackets), whereas it is undetectable in the cyclopamine-treated embryo (right). 1. Wolff C, Roy S, Ingham PW (2003) Multiple muscle cell identities induced by distinct levels and timing of hedgehog activity in the zebrafish embryo. Curr Biol 13: 1169–1181.