
Fig. S2
- ID
- ZDB-IMAGE-090408-57
- Publication
- Borodovsky et al., 2009 - Neural protein Olig2 acts upstream of the transcriptional regulator sim1 to specify diencephalic dopaminergic neurons
- All Figures
- Figures for Borodovsky et al., 2009
|
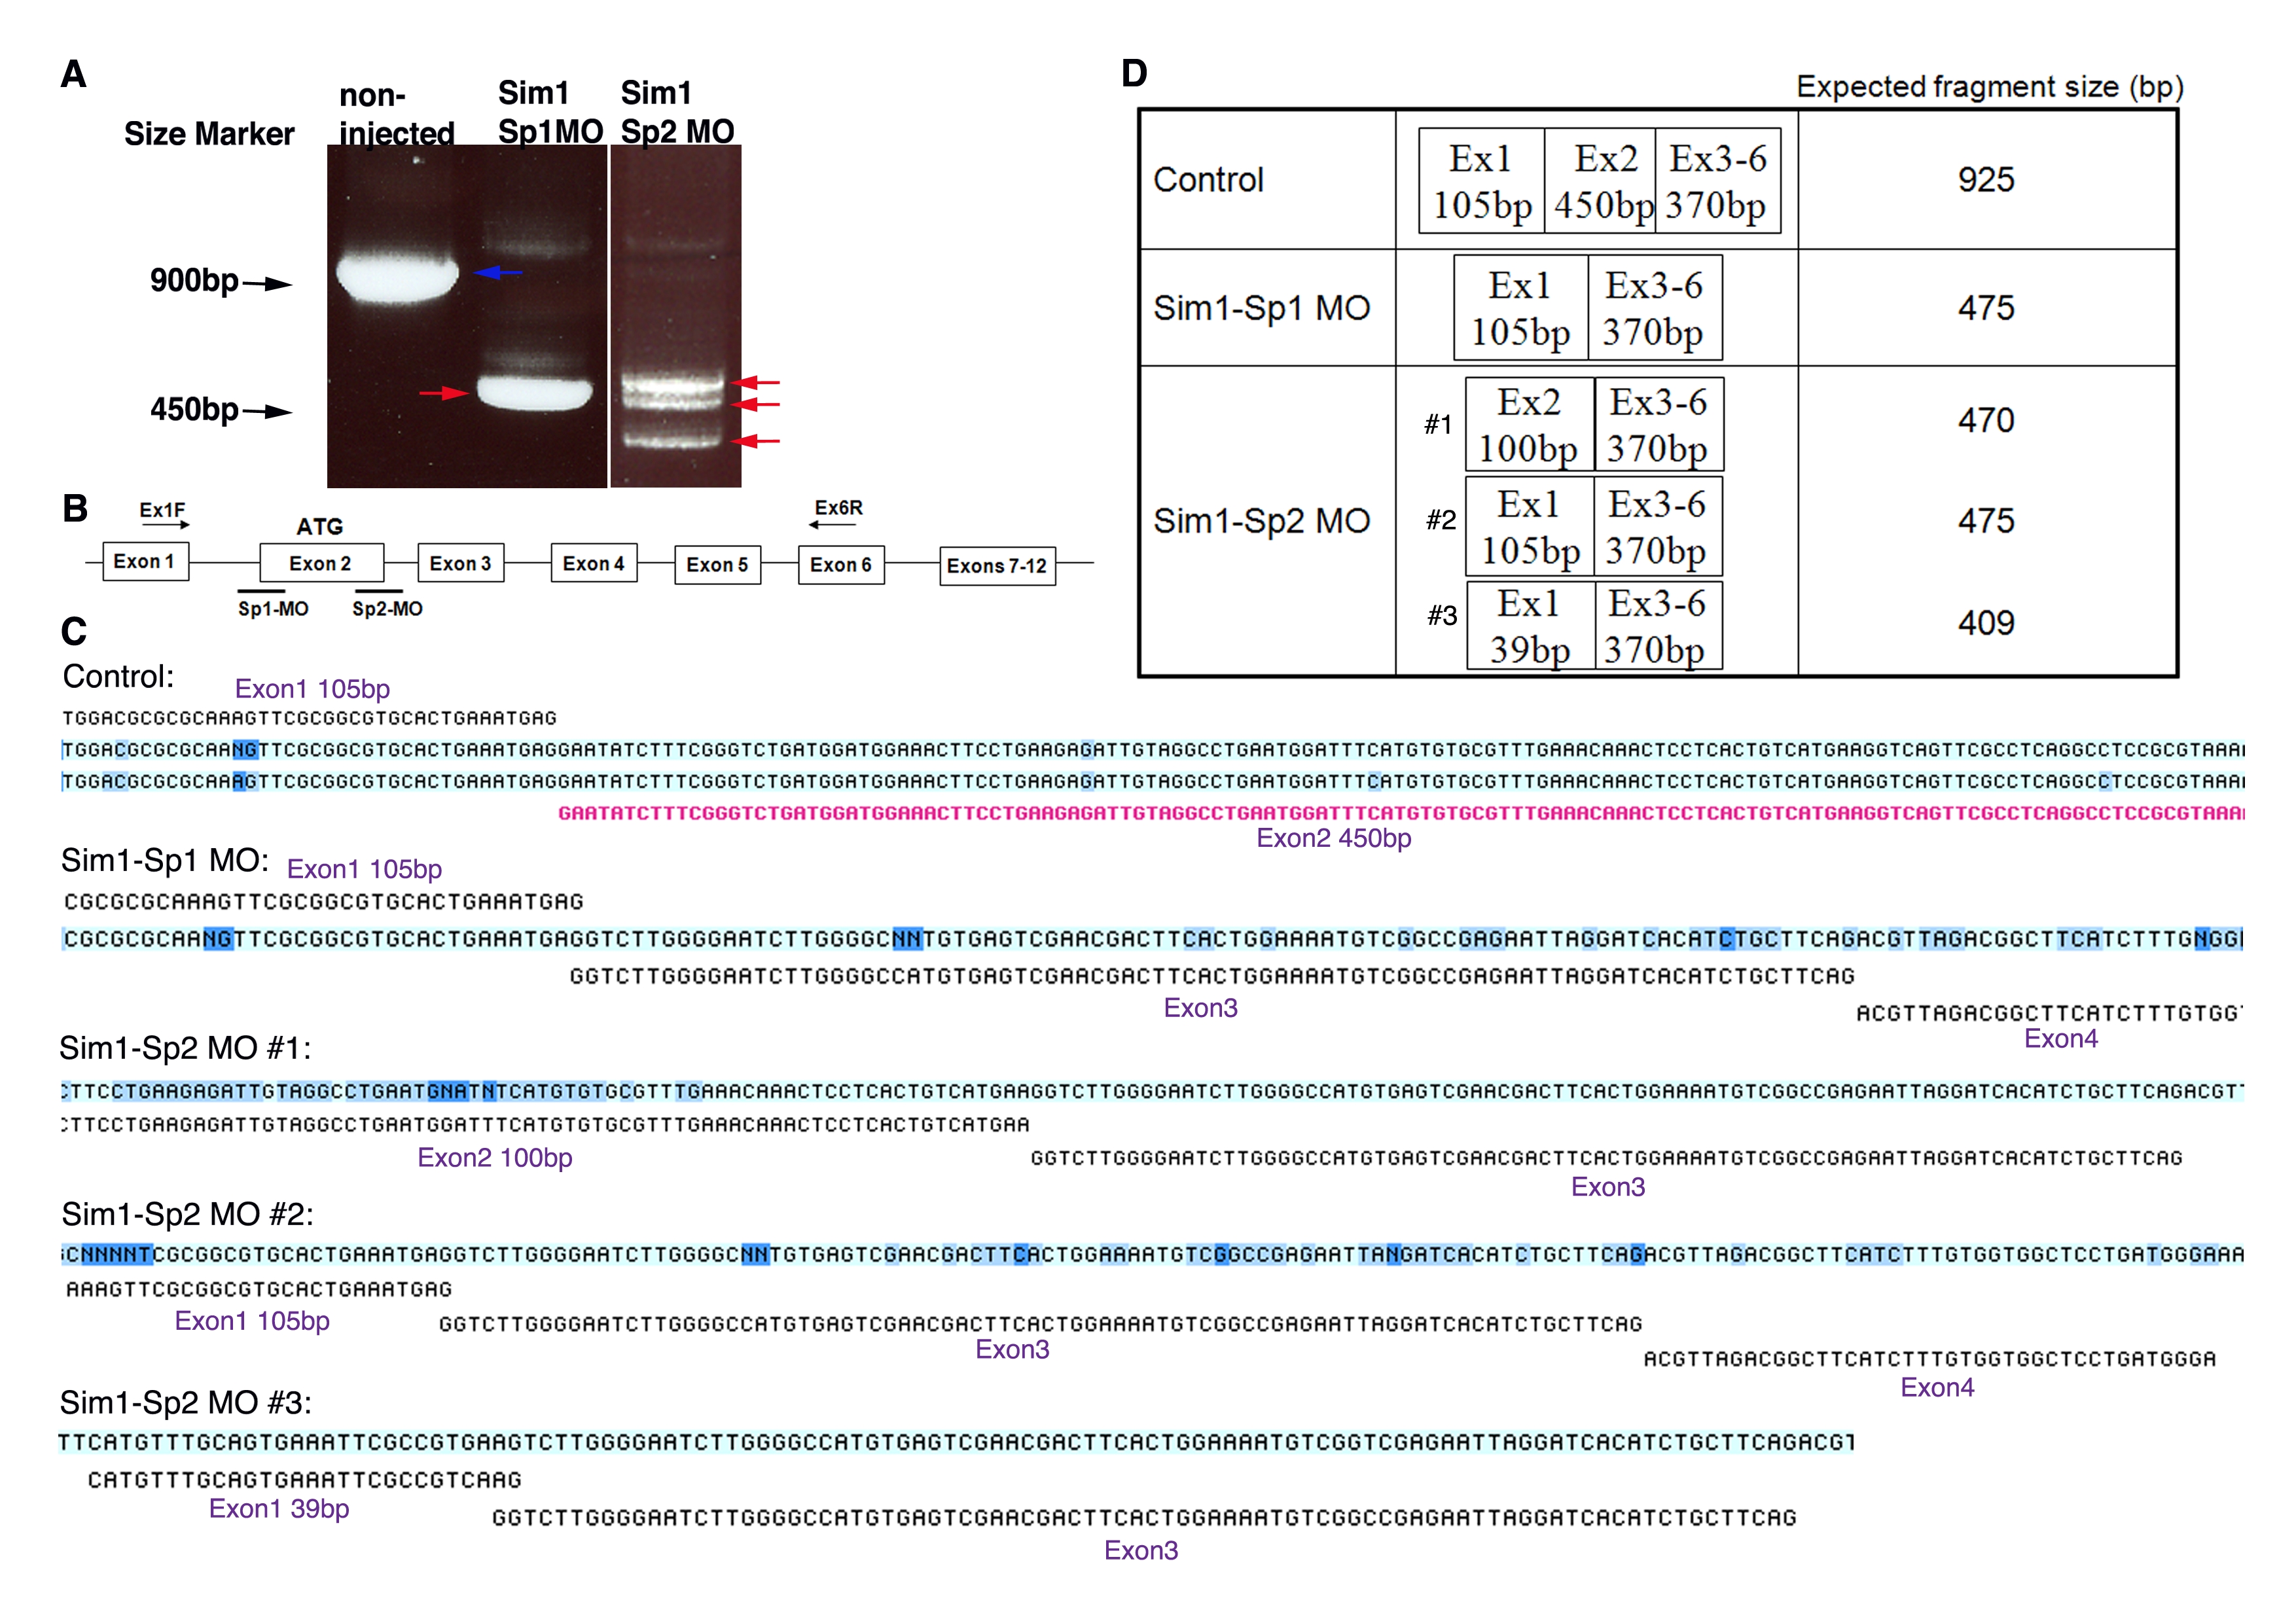
Fig. S2 Effects of Sim1 directed splice-blocking morpholinos. (A) Gel electrophoresis image showing altered RNA splicing products in embryos injected with splice-blocking morpholinos (MO; denoted Sim1 Sp1 and Sim1 Sp2). The blue arrow points to the correctly spliced mRNA, whereas red arrows indicate altered splicing products. (B) Scheme depicting Sim1 gene structure as well as antisense MO binding sites and the PCR primers used to amplify the various sim1 mRNA products. (C) Sim1 cDNA was amplified using reverse transcriptase-based PCR of total mRNA isolated from the control and MO injected embryos followed by nucleotide sequencing of the gel-excised DNA fragments. Obtained sequences (light blue) were compared to the correct form of Sim1 mRNA (black). Exon numbers and sizes are indicated. (D) A table summarizing the expected mRNA size in the control and MO injected embryos.