
|
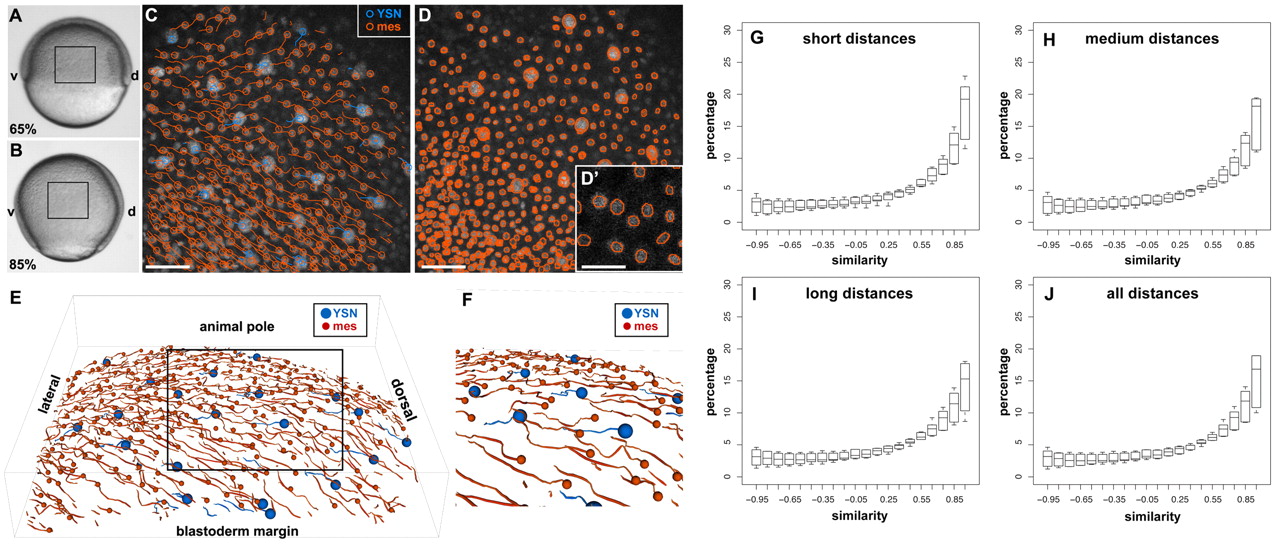
Fig. 1 Convergence movements are highly coordinated between iYSN and mesendoderm. (A,B) Bright-field images of an embryo at the beginning of gastrulation (6.5 hpf; A) and at mid-gastrulation (8.5 hpf; B). Animal pole is towards the top and dorsal is towards the right. Boxes delineate the imaged region in C-E. (C,E,F) Trajectories of iYSN and mesendoderm progenitors during gastrulation were obtained by imaging embryos by 2-photon excitation microscopy from 65% epiboly stage (6.5 hpf) until 85% epiboly stage (8.5 hpf), and analyzing these movies with a newly developed 3D tracking software. Dorsal is towards the right and circles indicate the endpoint of each track. (C) Z-projection showing iYSN (blue tracks) and mesendoderm (orange tracks) nuclear trajectories. (D) Z-projection depicting the efficacy of the image segmentation algorithm to detect nuclei in 3D. (D′) Magnification of a single slice of the image in D. The segment boundaries (in orange) are plane cuts of the ellipsoids detected by the image segmentation algorithm. Large ellipsoids represent iYSN, small ellipsoids represent cell nuclei. (E,F) 3D views of the trajectories of iYSN (blue tracks) and mesendoderm progenitors (orange tracks). (F) Magnification of boxed region in E. (G-J) Quantification of similarity values between iYSN and mesendoderm progenitors in wild-type embryos at mid-gastrulation stages (7-8 hpf). Histograms of the similarity values were generated separately for each embryo (n=6 embryos). Box plots show the distribution of the bin heights among the different embryos. (G) Similarity at short distances (0-40 μm). On average, 52% of the values are higher than 0.5. (H) Similarity at medium distances (40-80 μm). On average, 50% of the values are higher than 0.5. (I) Similarity at long distances (80-120 μm). On average, 48% of the values are higher than 0.5. (J) Similarity distribution considering all distances together. On average, 50% of the values are higher than 0.5. d, dorsal; v, ventral; mes, mesendoderm. Scale bars: 50 μm in C,D; 25 μm in D′.