
Fig. 5
- ID
- ZDB-IMAGE-090401-6
- Publication
- Sonawane et al., 2009 - Lgl2 and E-cadherin act antagonistically to regulate hemidesmosome formation during epidermal development in zebrafish
- All Figures
- Figures for Sonawane et al., 2009
|
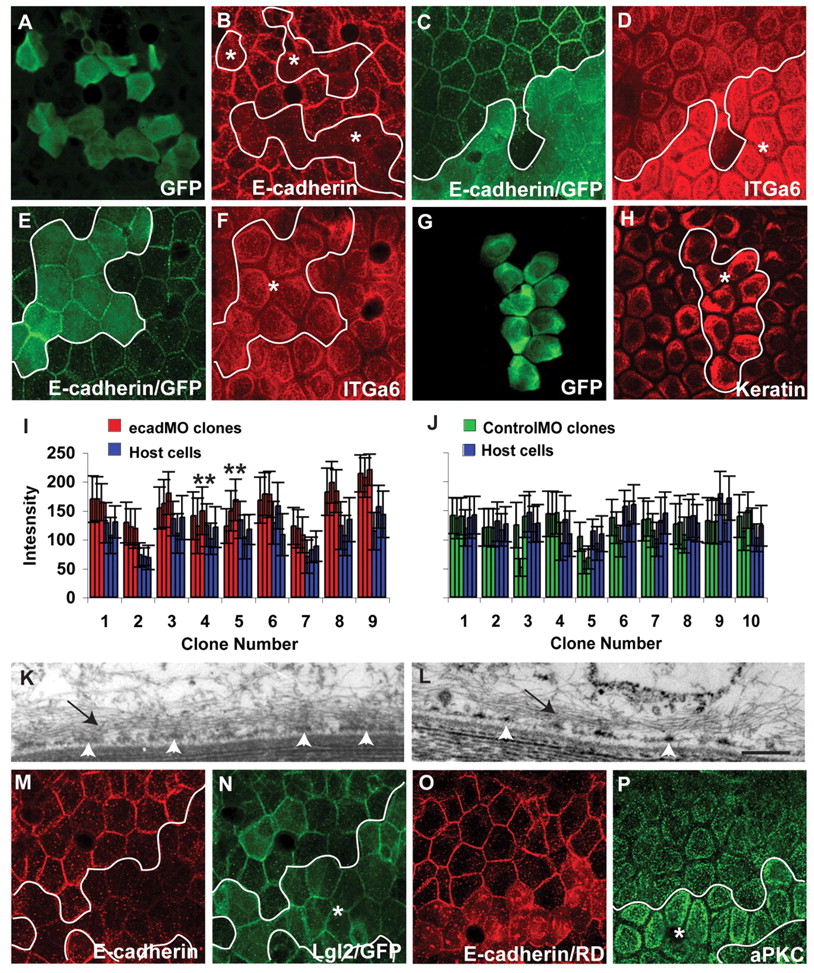
Fig. 5 The loss of E-cadherin function results in augmented localisation of Itga6 and increased hemidesmosome formation in the basal domain. (A-H) Immunostaining with anti-GFP, anti-E-cadherin, anti-Itga6 and anti-keratin antibodies as labelled. e-cadherin morpholino (ecadMO) clones (A) show consistent knockdown of E-cadherin in 5-day-old larvae (B). The knockdown of E-cadherin in clones (C) results in the enhanced localisation of Itga6 at the basal domain in 6-day-old larvae (D). The control morpholino clones (E), do not show any increase in Itga6 localisation to the basal domain (F). Furthermore, ecadMO clones (G) also exhibit enhanced localisation of hemidesmosomal keratin (H). Asterisks, epidermal clones. (I,J) Quantification of Itga6 signal intensity in ecadMO and control morpholino (controlMO) clones and surrounding host cells at 6 dpf. The mean intensity per cell is shown with s.d. This quantification reveals that in ecadMO clones, signal intensities for Itga6 are consistently higher than in the host cells (I), whereas in control morpholino clones they are not (J). Three comparisons out of nine (in clone number 4) and one comparison out of nine (in clone number 5) were not statistically significant by Student's t-test (**P≤0.05). (K,L) Electron micrograph of an ecadMO clonal cell (K) and control wild-type cell in the same region (L). In ecadMO clones, hemidesmosomes coalesce to form electron-dense mats (arrowheads in K), which contrast with electron-dense punctae in control cells at 6 dpf (arrowheads in L). Note the macrofilaments projecting out of the hemidesmosomal mats and punctae (arrows). (M-P) Co-immunostaining using anti-E-cadherin (M) and anti-Lgl2 (N) antibodies, or anti-E-cadherin (O) and anti-aPKC (P) antibodies. e-cadherin knockdown in the basal epidermis (M) does not alter the localisation of Lgl2 at 5 dpf (N). However, ecadMO clones (O) do exhibit increased localisation of aPKC to the basal domain (P). In C,E,H, the cytoplasmic green fluorescence represents GFP, whereas in O the cytoplasmic red fluorescence represents Rhodamine-dextran (RD). Our fixation conditions do not lead to complete quenching of GFP and Rhodamine fluorescence. Scale bar: 27 μm in A-H; 270 nm in K,L.