
IMAGE
Fig. S2
- ID
- ZDB-IMAGE-090401-31
- Publication
- Gomez et al., 2009 - Discovery and characterization of novel vascular and hematopoietic genes downstream of etsrp in zebrafish
- All Figures
- Figures for Gomez et al., 2009
Image
|
Figure Caption
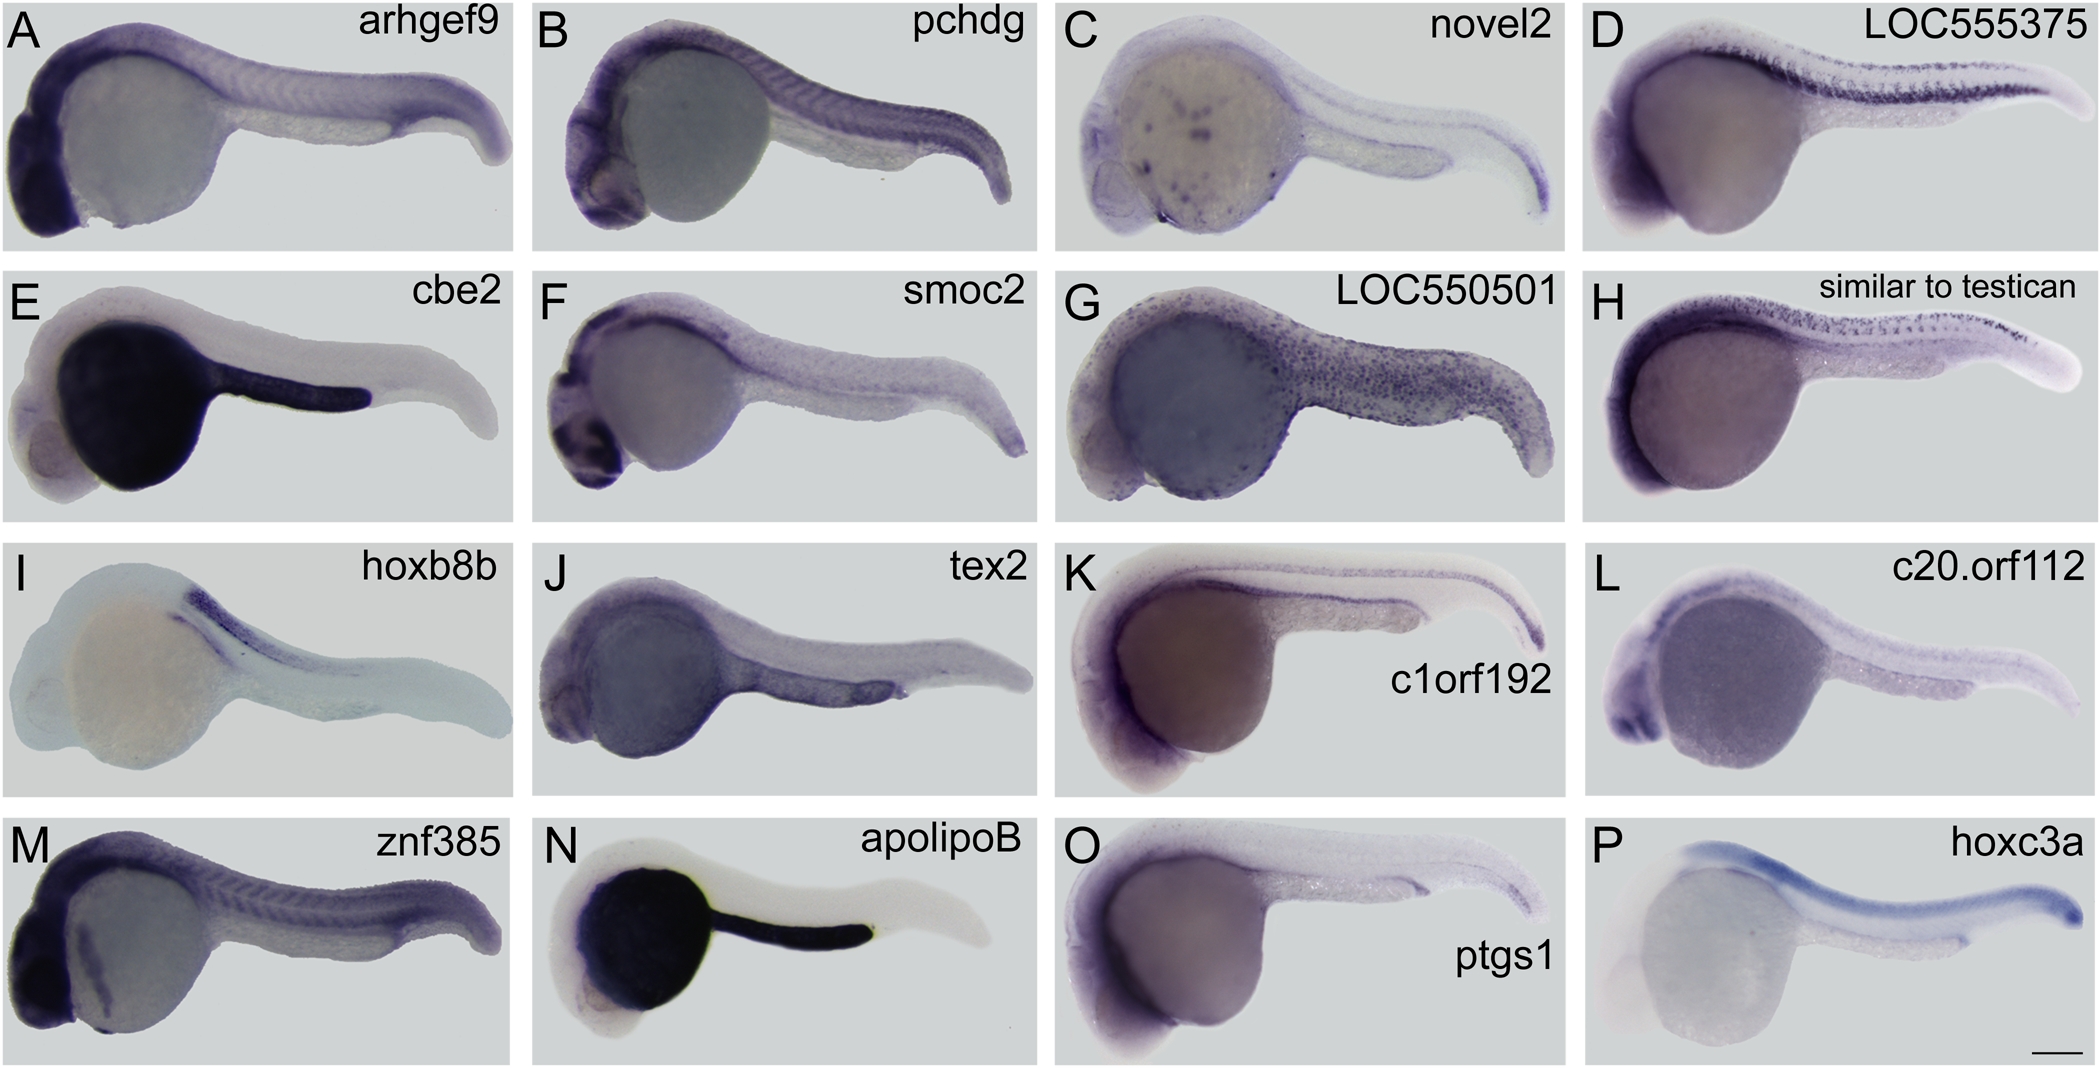
Fig. S2 Genes induced by etsrp overexpression but not expressed in blood or vessels. (A) arhgef9; (B) pchdg; (C) novel2; (D) LOC555375 (expression is in ventral somites not vasculature); (E) cbe2; (F) smoc2; (G) LOC550501; (H) similar to testican; (I) hoxb8b; (J) tex2; (K) c1orf192; (L) c20.orf112; (M) znf385; (N) apolipoB; (O) ptgs1; and (P) hoxc3a. Scale bar: 250 μm.
Acknowledgments
This image is the copyrighted work of the attributed author or publisher, and
ZFIN has permission only to display this image to its users.
Additional permissions should be obtained from the applicable author or publisher of the image.
Full text @ PLoS One