
|
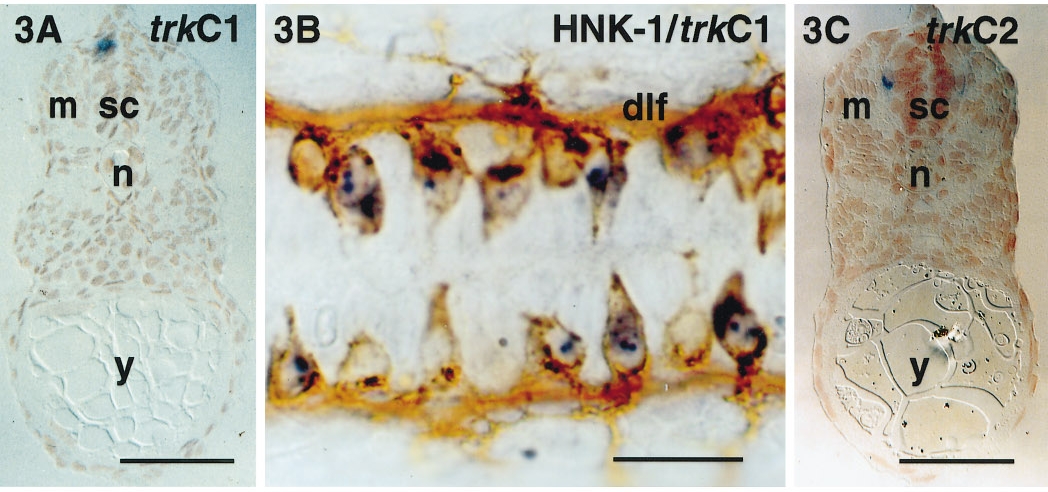
Fig. 3 The expression of trkC1 in Rohon–Beard cells in the spinal cord and the location of trkC2 expression in the trunk. (A) A transverse section of the trunk of a trkC1-hybridized embryo showing the position of the positive cell in the dorsal spinal cord and (B) a dorsal view of the trunk with trkC1 (blue) and the HNK-1 antibody (brown) double labeling. Rostral is to the left. The position of the dorsal longitudinal fascicle (dlf) is indicated. (C) A transverse section of a trkC2-hybridized embryo showing the position of the positive cell in the trunk, relative to the muscle (m), spinal cord (sc), and notochord (n). y, yolk. Scale bars, 50 μm (A, C); 25 μm (B).
Reprinted from Developmental Biology, 195, Martin, S.C., Sandell, J.H., and Heinrich, G., Zebrafish TrkC1 and TrkC2 receptors define two different cell populations in the nervous system during the period of axonogenesis, 114-130, Copyright (1998) with permission from Elsevier. Full text @ Dev. Biol.