
|
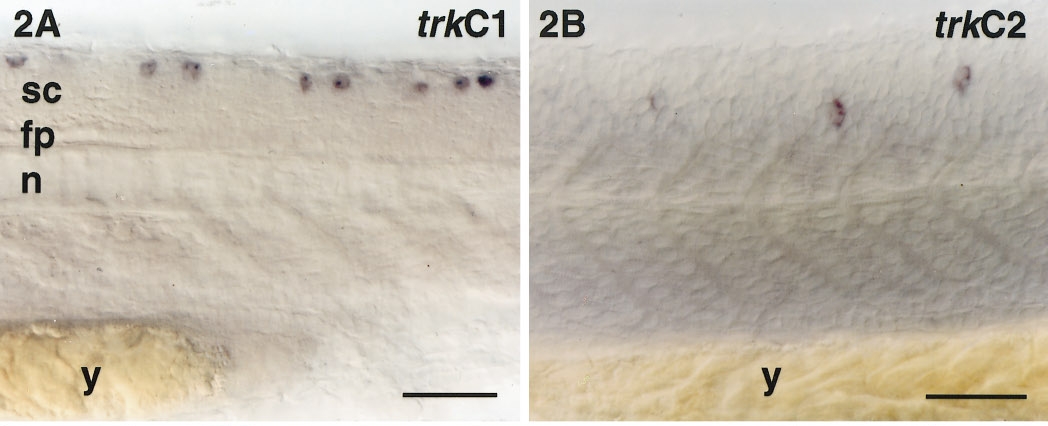
Fig. 2 Whole-mount in situ hybridization with trkC1 and trkC2 antisense digoxigenin-labeled RNA probes. A lateral view of the trunk of trkC1-hybridized (A) and trkC2-hybridized (B) embryos. Rostral is to the left and dorsal is up. The hybridization signal is blue and is found in the dorsal trunk for trkC1 and more ventrally for trkC2. The positions of the spinal cord (sc), floor plate (fp), notochord (n), and yolk (y) are indicated. The plane of focus required to view the trkC1- and trkC2-positive cells is different. In A the trkC1-positive cells are in the same plane of focus as the spinal cord and notochord, whereas in B the trkC2-positive cells are in the same plane of focus as the muscle. In addition, the somite boundaries can be more easily seen in B than in A. All scale bars, 50 μm.
Reprinted from Developmental Biology, 195, Martin, S.C., Sandell, J.H., and Heinrich, G., Zebrafish TrkC1 and TrkC2 receptors define two different cell populations in the nervous system during the period of axonogenesis, 114-130, Copyright (1998) with permission from Elsevier. Full text @ Dev. Biol.