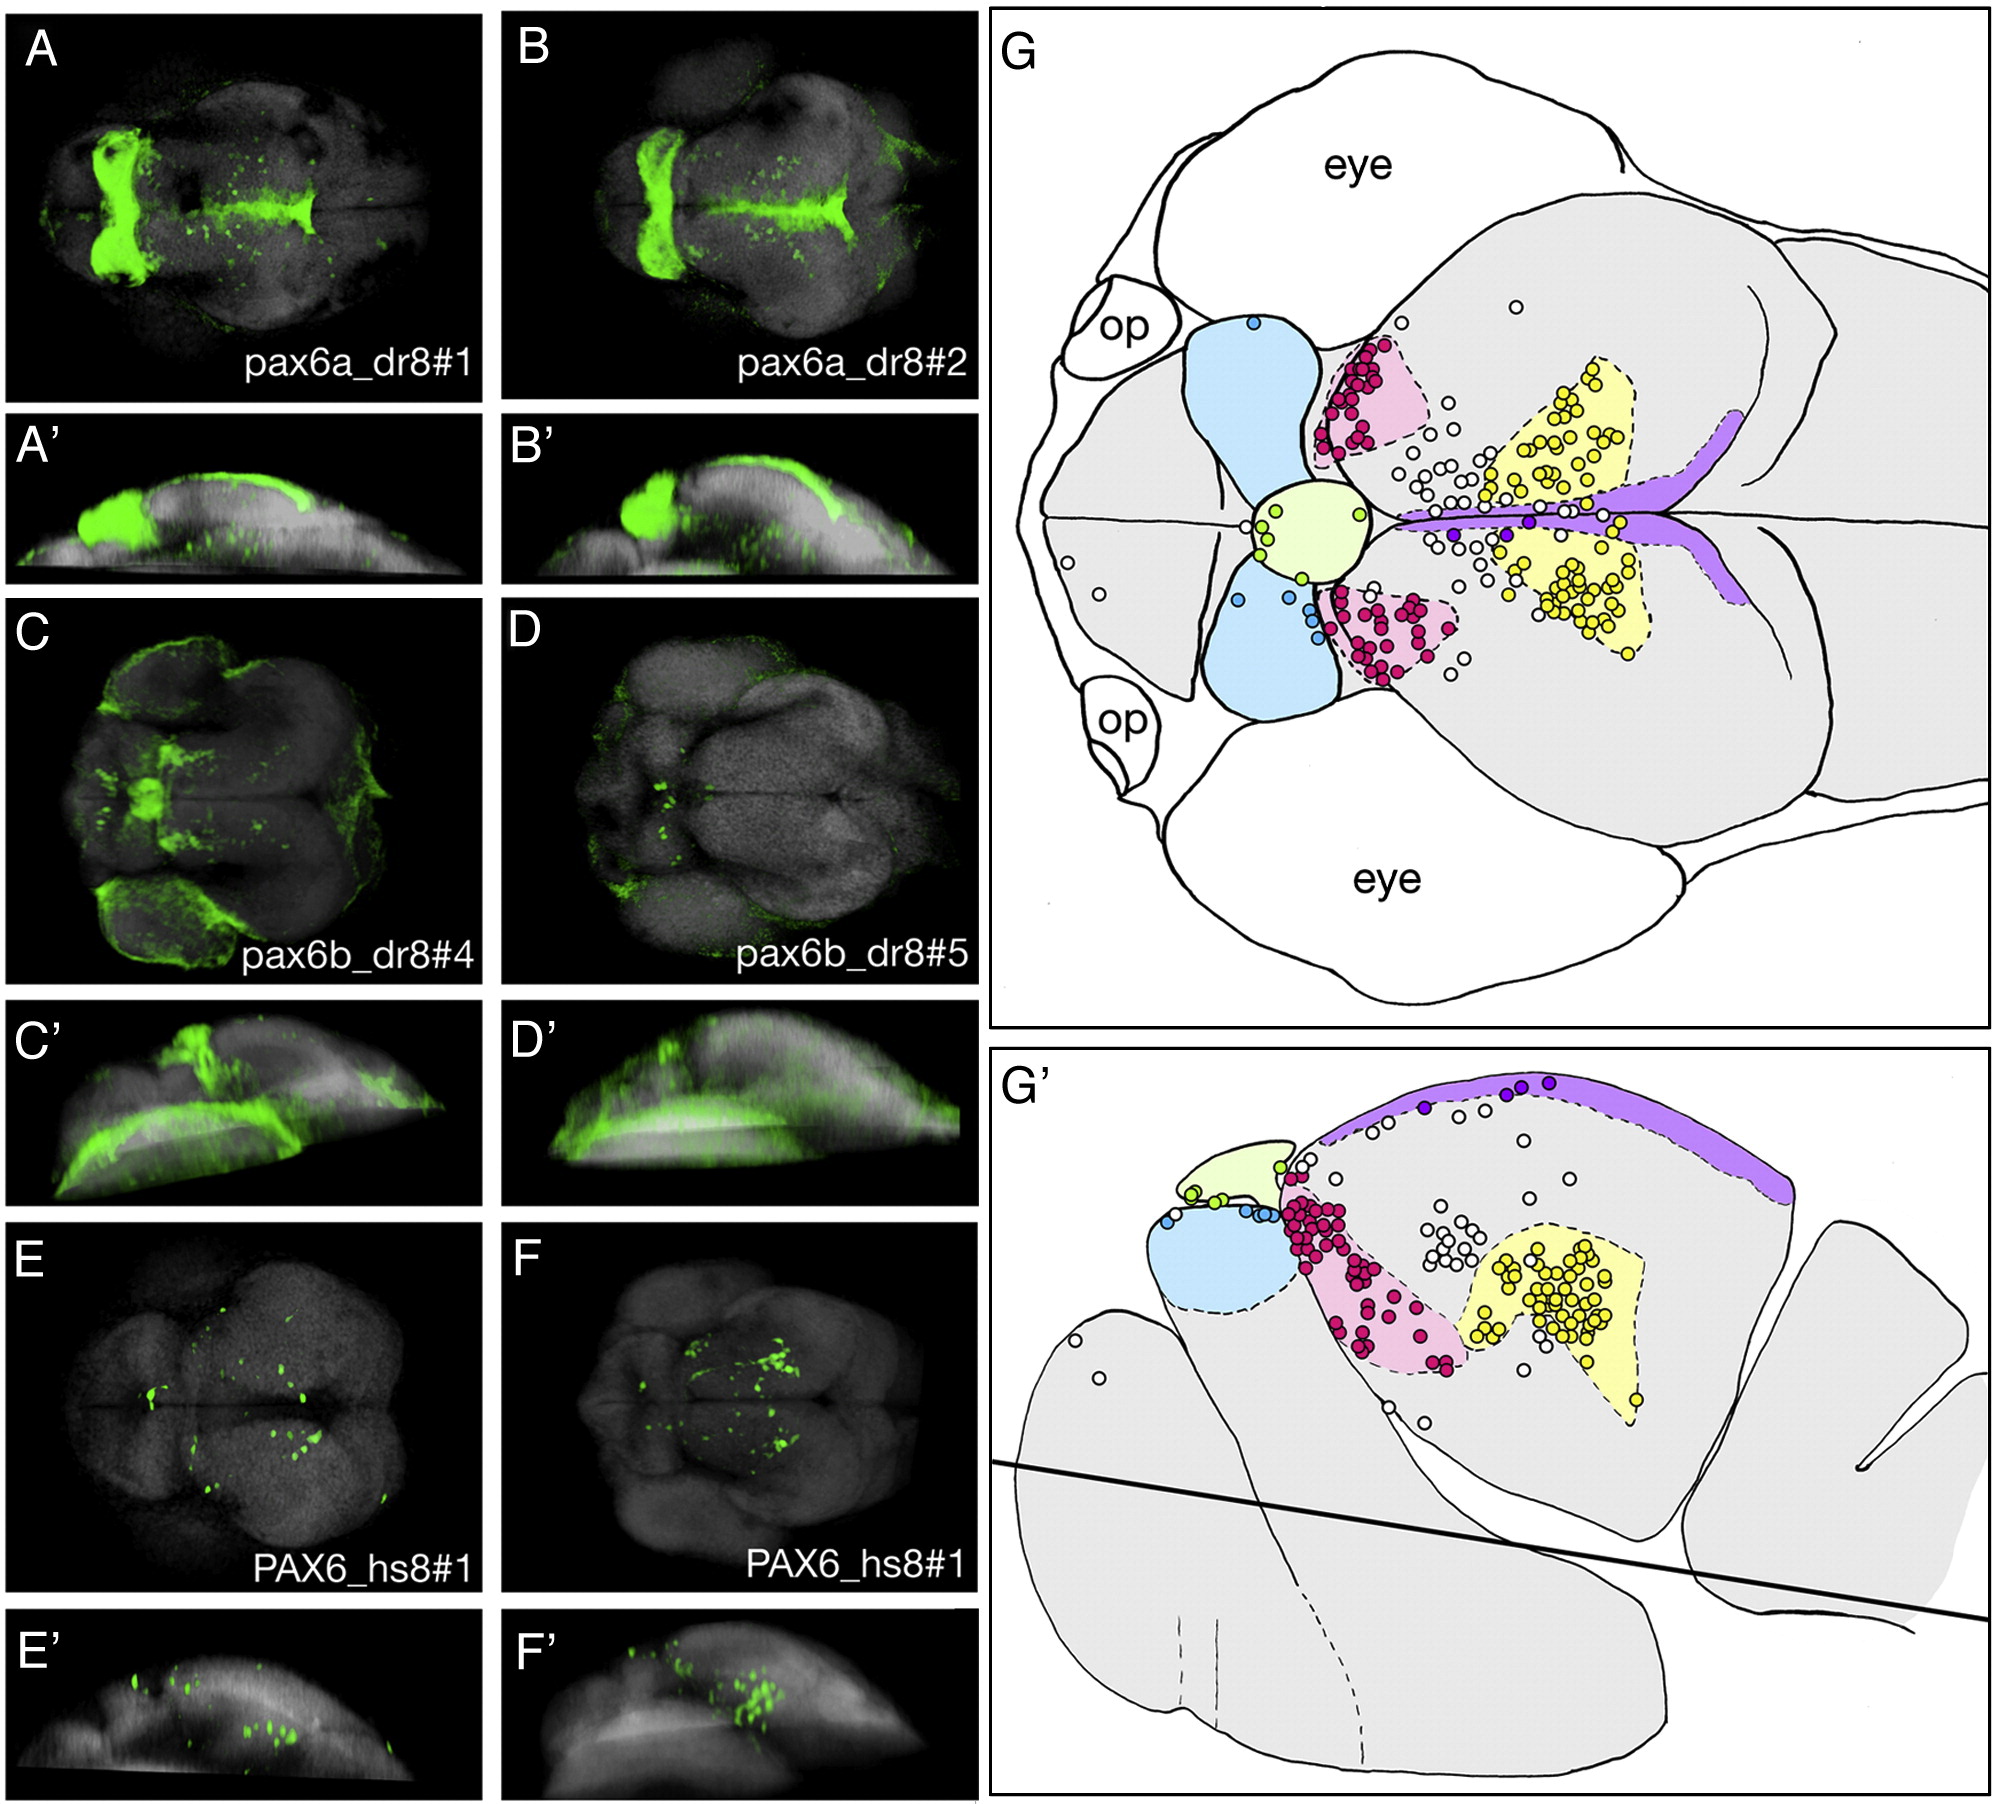
Fig. 6 Confocal study of PAX6 HCNE8. (A–F′) 3D reconstructions of dorsally-imaged confocal stacks of 3 dpf embryos, transgenic genotype indicated top right, stained using immunohistochemistry for GFP (green) combined with TOPRO nuclear staining (grey). Viewed from dorsal (A, B, C, D, E, F) and lateral (A′, B′, C′, D′, E′, F′) aspects. Areas of GFP expression in embryos bearing GFP transgenes driven by zebrafish pax6a (A, A′, B, B′) and pax6b (C, C′, D, D′) HCNE 8 were mapped onto schematic diagrams of the brain of a 3 dpf embryo drawn from dorsal (G) and lateral (with eye removed; G′) viewpoints as coloured areas: pineal = green, habenulae = blue, pretectal area = red, dorsal (roofplate) tectum = purple, dorsal tegmentum = yellow. 3D reconstructions were used to plot the locations of GFP-positive cells for multiple PAX6_hs8 embryos (n = 6) (examples E, E′, F, F′) using coloured circles. Where GFP-positive cells fell within the zones of either zebrafish HCNE 8-driven transgene expression the circle was coloured the equivalent colour. Where they fell outside these areas they were left white. The lateral schematic (G′) represents summated expression from both left and right sides of the brain, the black line across the image represents the depth of the 3D reconstructions employed (op = olfactory pits).
Reprinted from Developmental Biology, 327(2), Navratilova, P., Fredman, D., Hawkins, T.A., Turner, K., Lenhard, B., and Becker, T.S., Systematic human/zebrafish comparative identification of cis-regulatory activity around vertebrate developmental transcription factor genes, 526-540, Copyright (2009) with permission from Elsevier. Full text @ Dev. Biol.

