
IMAGE
Fig. S2
- ID
- ZDB-IMAGE-090320-30
- Publication
- Stedman et al., 2009 - A functional interaction between Irx and Meis patterns the anterior hindbrain and activates krox20 expression in rhombomere 3
- All Figures
- Figures for Stedman et al., 2009
Image
|
Figure Caption
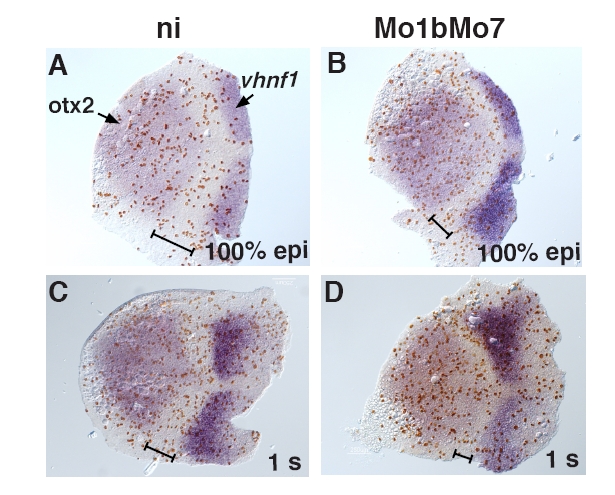
Fig. S2 Cell proliferation in Mo1bMo7 morphants. Embryos uninjected (ni, A, C) or injected with Mo1b and Mo7 (B, D) were fixed at 100% epiboly (A, B) or 1 s (C, D) and subjected to ISH with probes for otx2 and vhnf1 and IHC for the mitosis marker phosphorylated-Histone H3 (H3P). The number of mitotic cells per surface unit was counted in the anterior hindbrain, defined as the territory located between the otx2 and vhnf1 expression domains (black line). Anterior is toward the left.
Acknowledgments
This image is the copyrighted work of the attributed author or publisher, and
ZFIN has permission only to display this image to its users.
Additional permissions should be obtained from the applicable author or publisher of the image.
Reprinted from Developmental Biology, 327(2), Stedman, A., Lecaudey, V., Havis, E., Anselme, I., Wassef, M., Gilardi-Hebenstreit, P., and Schneider-Maunoury, S., A functional interaction between Irx and Meis patterns the anterior hindbrain and activates krox20 expression in rhombomere 3, 566-577, Copyright (2009) with permission from Elsevier. Full text @ Dev. Biol.