
Fig. 1
- ID
- ZDB-IMAGE-090304-59
- Publication
- Ma et al., 2009 - Establishment of a transitory dorsal-biased window of localized Ca(2+) signaling in the superficial epithelium following the mid-blastula transition in zebrafish embryos
- All Figures
- Figures for Ma et al., 2009
|
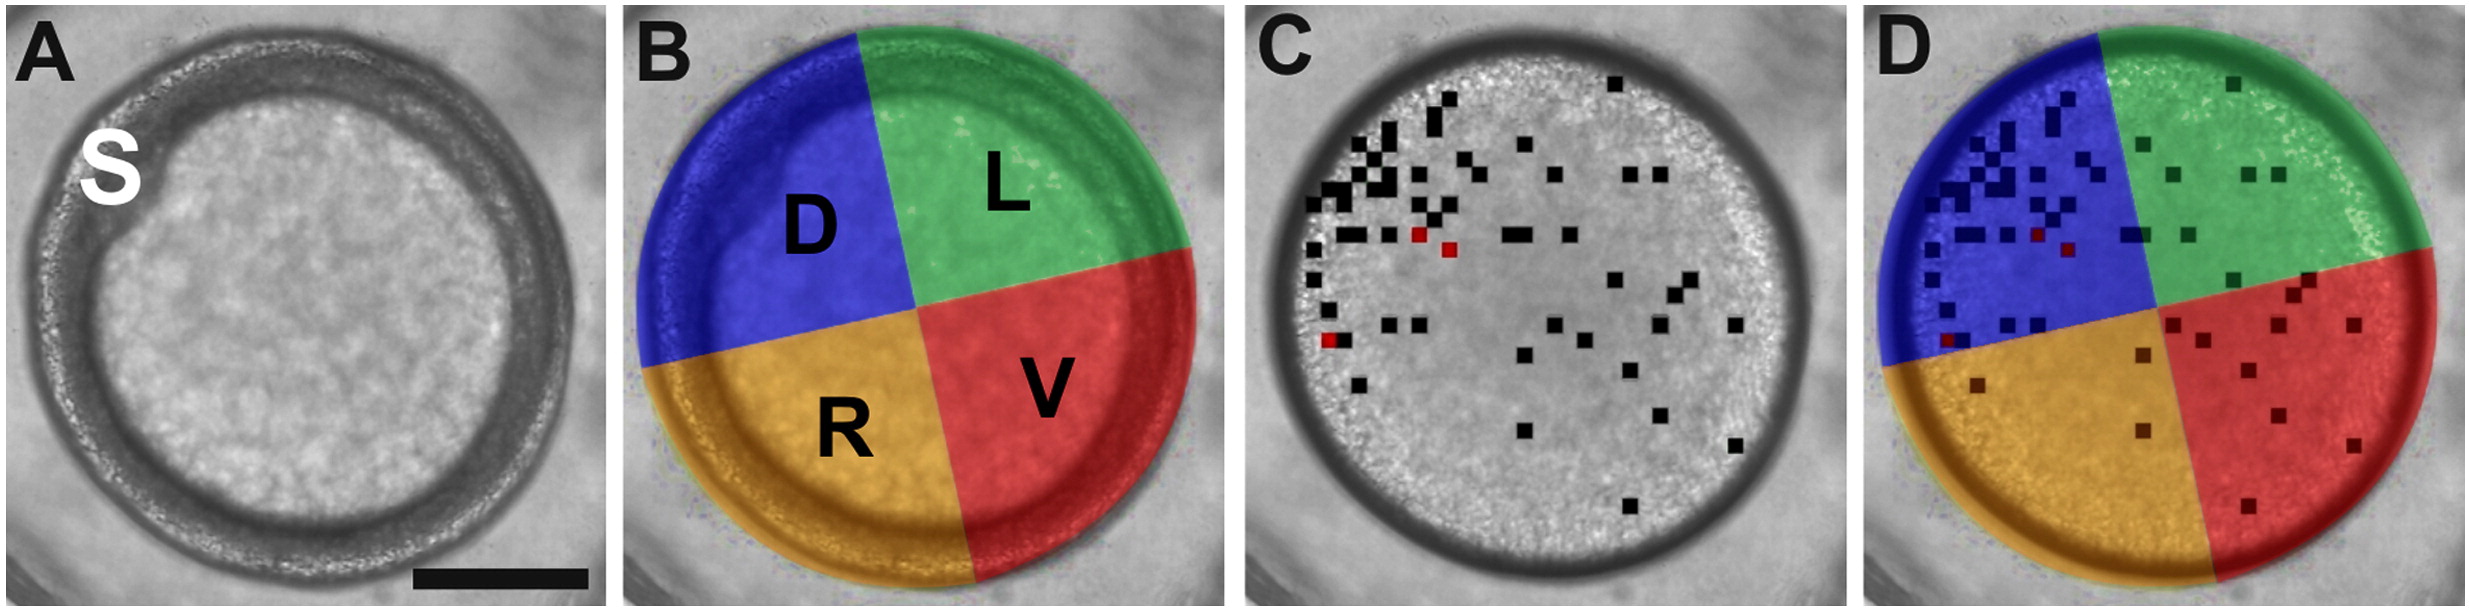
Fig. 1 The quadrant analysis protocol. (A) A representative bright-field image of an embryo in an animal pole orientation at ∼ 6 hpf; the embryonic shield is labeled with an “S”. (B) Using the position of the shield to identify the dorsal region, the embryo was then divided into the dorsal (D), ventral (V), left (L) and right (R) quadrants. (C) The Ca2+ transients detected by the automated analysis algorithm from 2.25 hpf to 6 hpf were then superimposed onto the corresponding bright-field image (i.e., ∼ 3 hpf in this example). The black and red squares indicate where one or two Ca2+ transients were generated, respectively. (D) Assignment of these transients to the appropriate quadrant by retrospective application of the positional information obtained at 6 hpf. This analysis protocol was only applied to data acquired from embryos that were held stationary throughout the imaging period. Scale bar = 200 μm.
Reprinted from Developmental Biology, 327(1), Ma, L.H., Webb, S.E., Chan, C.M., Zhang, J., and Miller, A.L., Establishment of a transitory dorsal-biased window of localized Ca(2+) signaling in the superficial epithelium following the mid-blastula transition in zebrafish embryos, 143-157, Copyright (2009) with permission from Elsevier. Full text @ Dev. Biol.