
Fig. 2
- ID
- ZDB-IMAGE-090220-2
- Publication
- Ota et al., 2009 - The roles of the FGF signal in zebrafish embryos analyzed using constitutive activation and dominant-negative suppression of different FGF receptors
- All Figures
- Figures for Ota et al., 2009
|
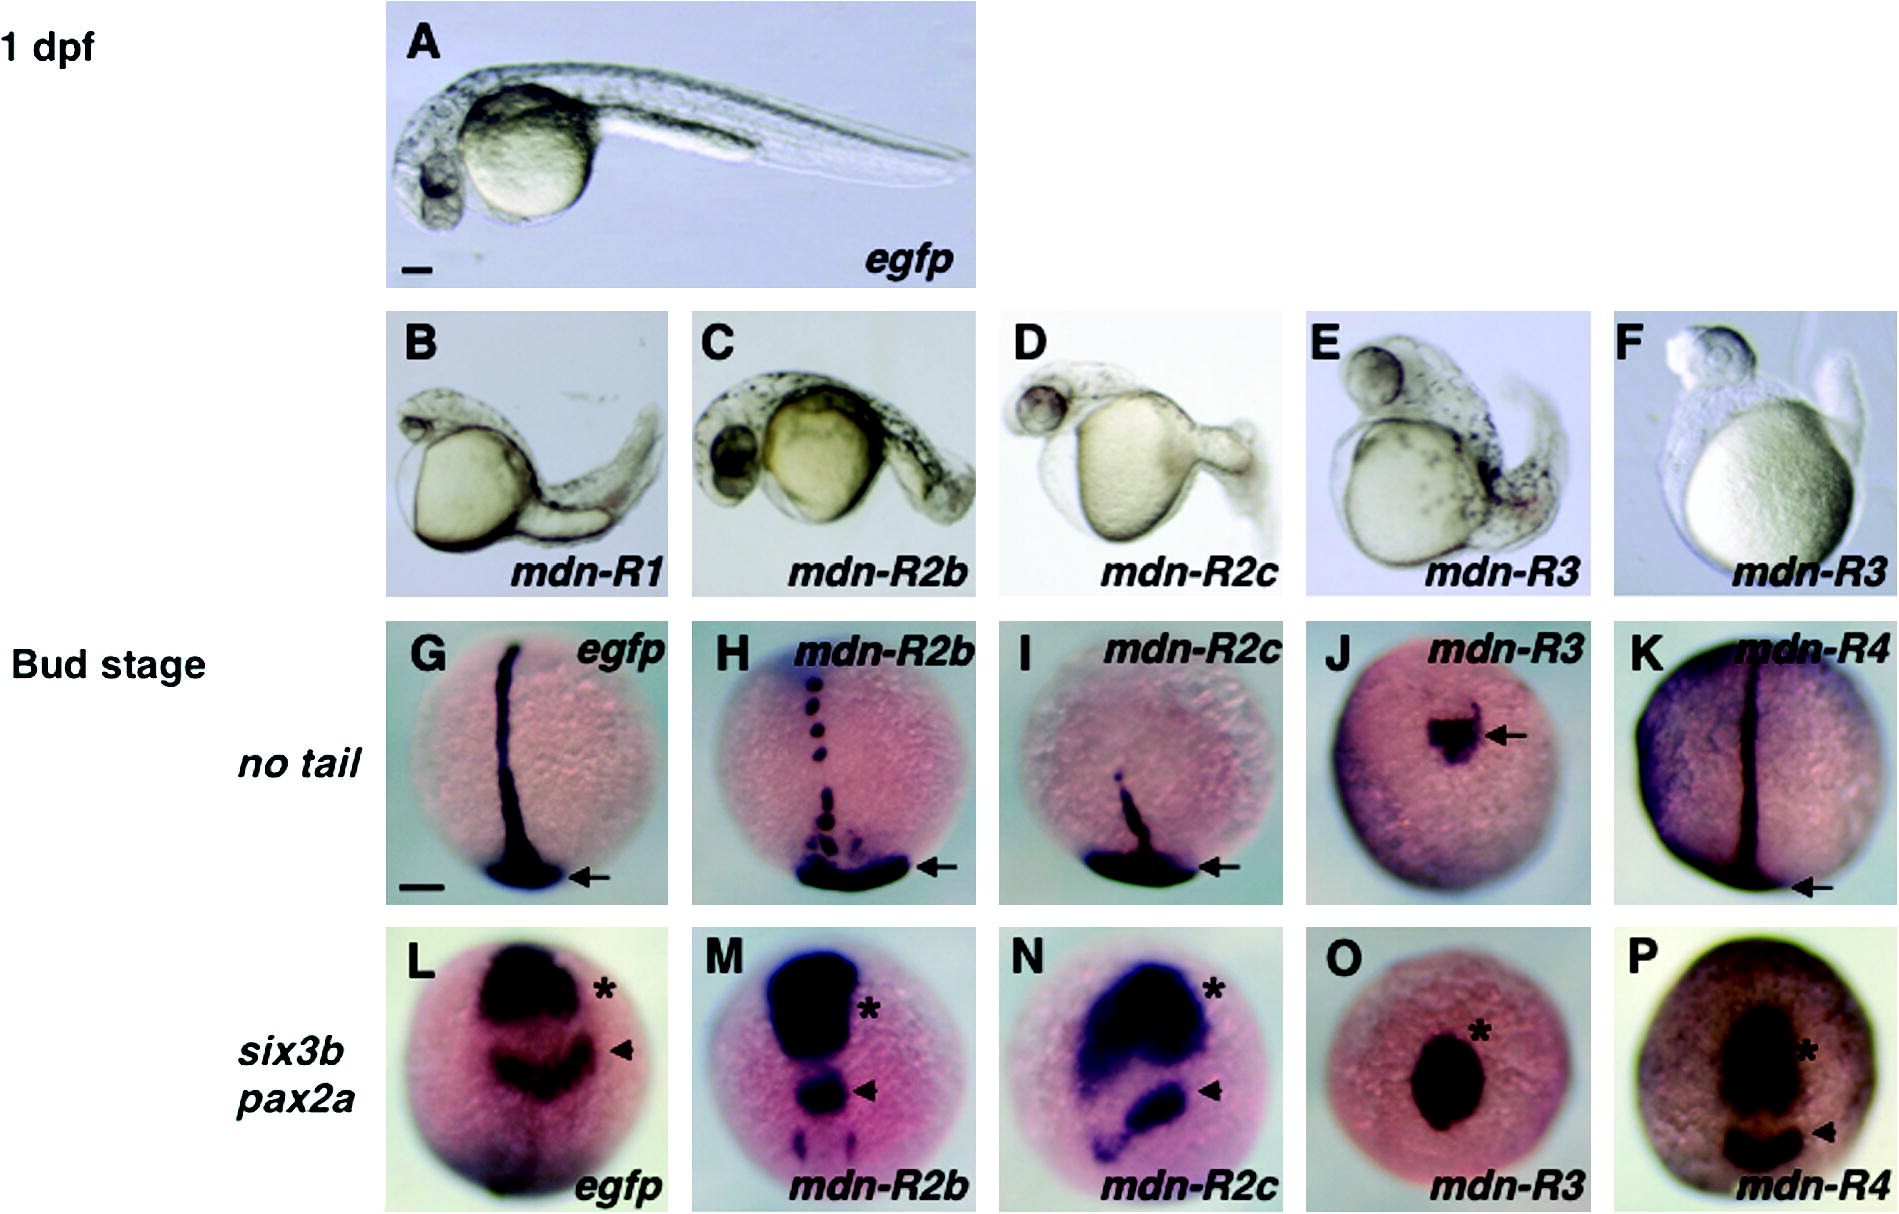
Fig. 2 Zebrafish embryos overexpressing different mdn-FGFRs. Embryos were injected with mRNA (300 pg/embryo) for egfp (A, G, and L) or mdn-FGFRs (B–F, H–K, and M–P). (A–F) Lateral views of 26-hpf embryos with anterior to the left and dorsal to the top. (G–I, K–N, and P) Dorsal views of bud-stage embryos with anterior to the top. (J and O) Vegetal view (J) or animal view (O) of bud-stage embryos with dorsal to the top (J) or bottom (O), respectively. Embryos were stained for the expression of ntl in the notochord (G–K) or six3b and pax2a in the forebrain (asterisk) and MHB (triangle), respectively (L–P). Scale bars, 100 μm.
Reprinted from Mechanisms of Development, 126(1-2), Ota, S., Tonou-Fujimori, N., and Yamasu, K., The roles of the FGF signal in zebrafish embryos analyzed using constitutive activation and dominant-negative suppression of different FGF receptors, 1-17, Copyright (2009) with permission from Elsevier. Full text @ Mech. Dev.