
Fig. 1
- ID
- ZDB-IMAGE-090220-1
- Publication
- Ota et al., 2009 - The roles of the FGF signal in zebrafish embryos analyzed using constitutive activation and dominant-negative suppression of different FGF receptors
- All Figures
- Figures for Ota et al., 2009
|
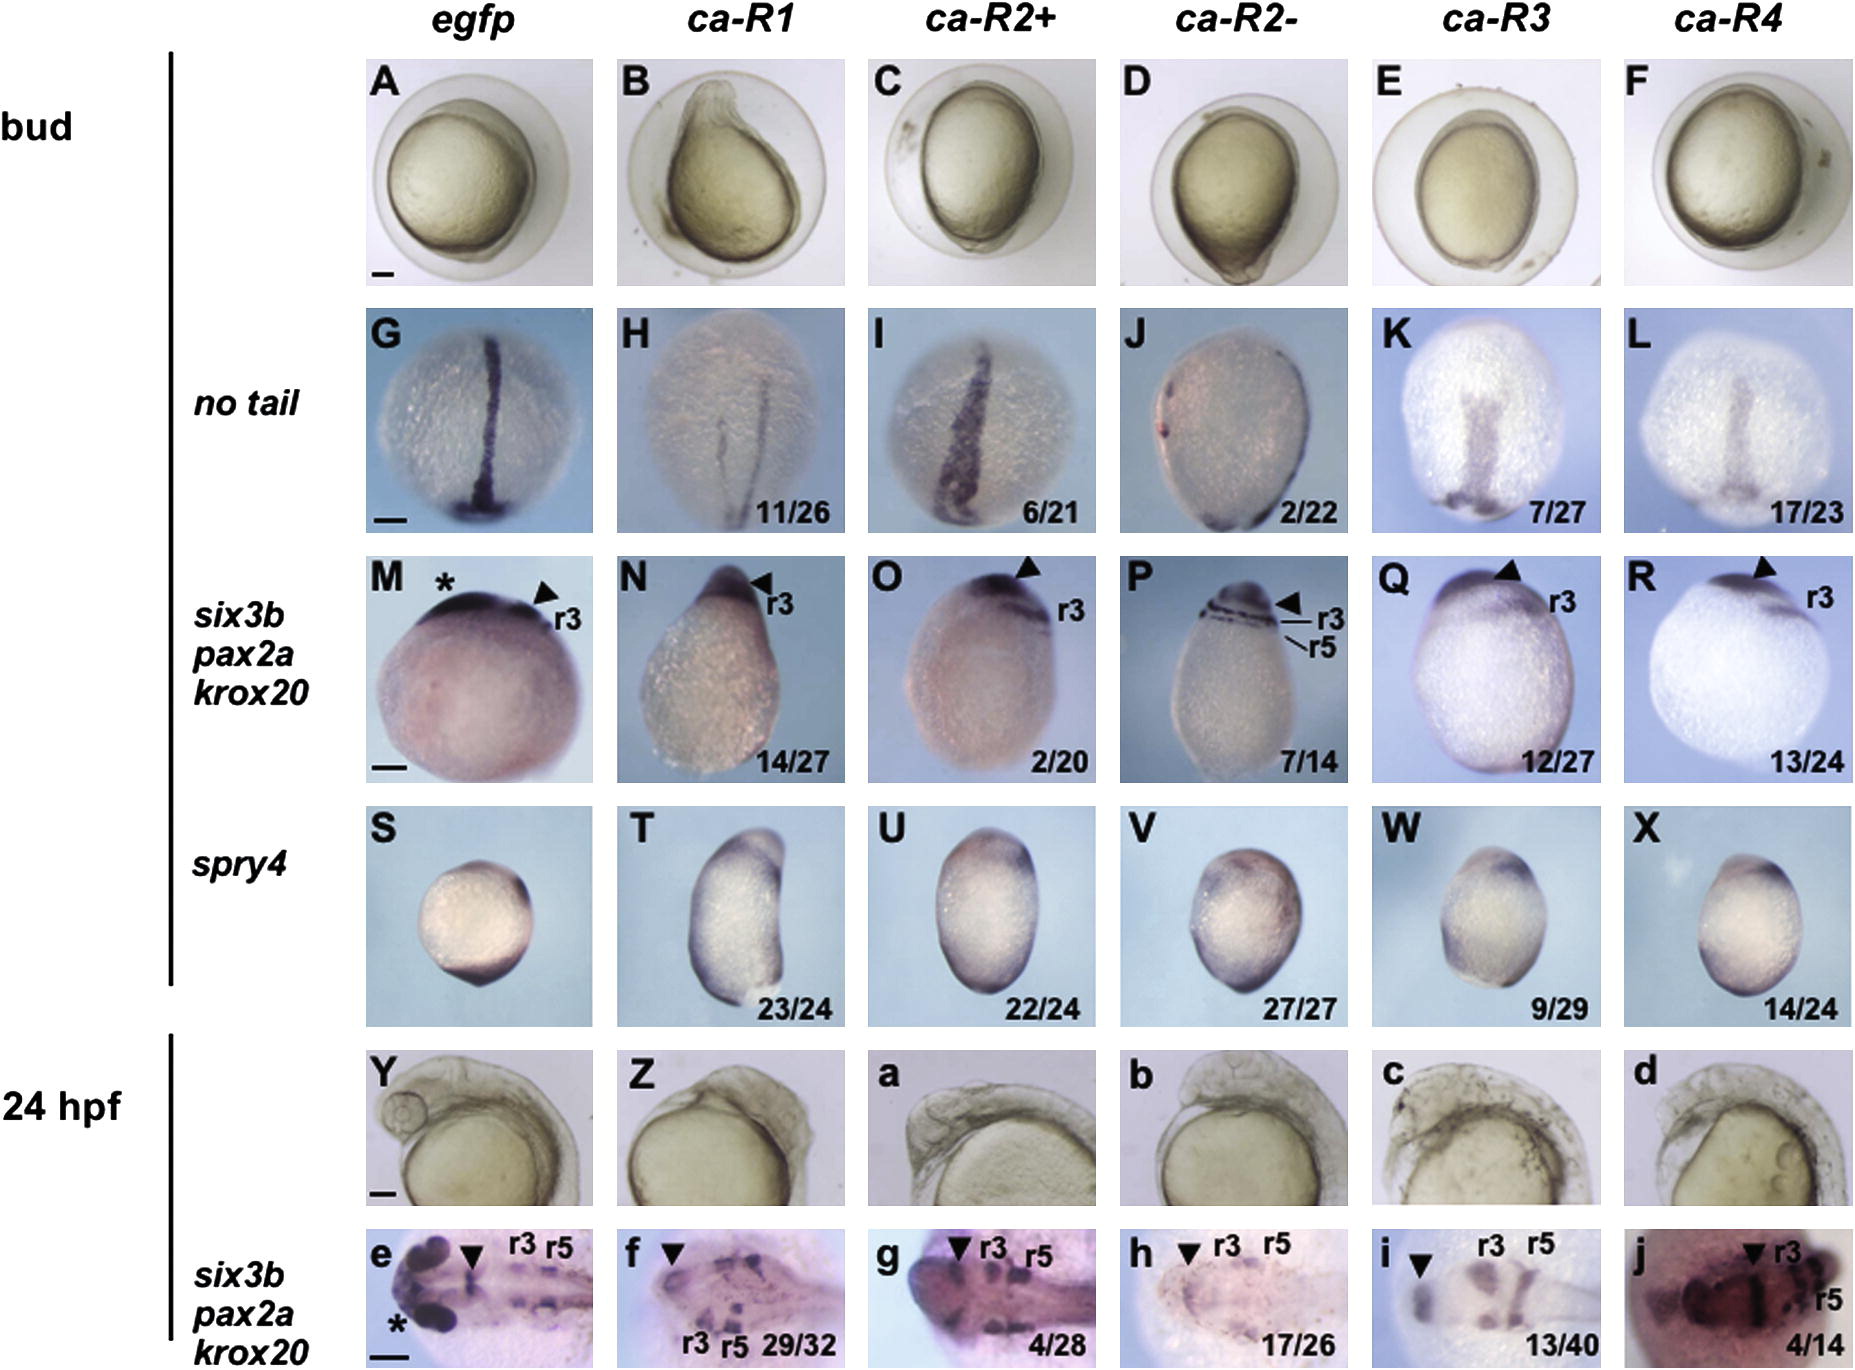
Fig. 1 Effects of ca-FGFRs on early development of zebrafish embryos. Alive views (A–F and Y-d) or marker expression patterns (G–X and e–j) of embryos, which were injected with mRNA for ca-FGFRs that are specified at the top (50 pg/embryo except for ca-R3, for which 5 pg mRNA/embryo was used), are shown at the bud stage (A–X) or 24 hpf (Y-j). (G–L) Expression of ntl in the notochord. (M–R and e–j) The expression of six3b, pax2a, and krox20 in the forebrain (asterisk), MHB (triangle), and hindbrain (r3, r5), respectively. (S–X) The expression of spry4 as a readout of the FGF signal. When the expression was considered abnormal compared with control embryos injected with egfp mRNA, the numbers of abnormal embryos and those of stained embryos are shown at the bottom right. (A–F, J, and M-d) Lateral views with dorsal to the right (A–F, J, and M–X) or to the top (Y-d). (G–I, K, L, and e–j) Dorsal views with anterior to the top (G–I, K, and L) or to the left (e–j). Scale bars, 100 μm.
Reprinted from Mechanisms of Development, 126(1-2), Ota, S., Tonou-Fujimori, N., and Yamasu, K., The roles of the FGF signal in zebrafish embryos analyzed using constitutive activation and dominant-negative suppression of different FGF receptors, 1-17, Copyright (2009) with permission from Elsevier. Full text @ Mech. Dev.