
|
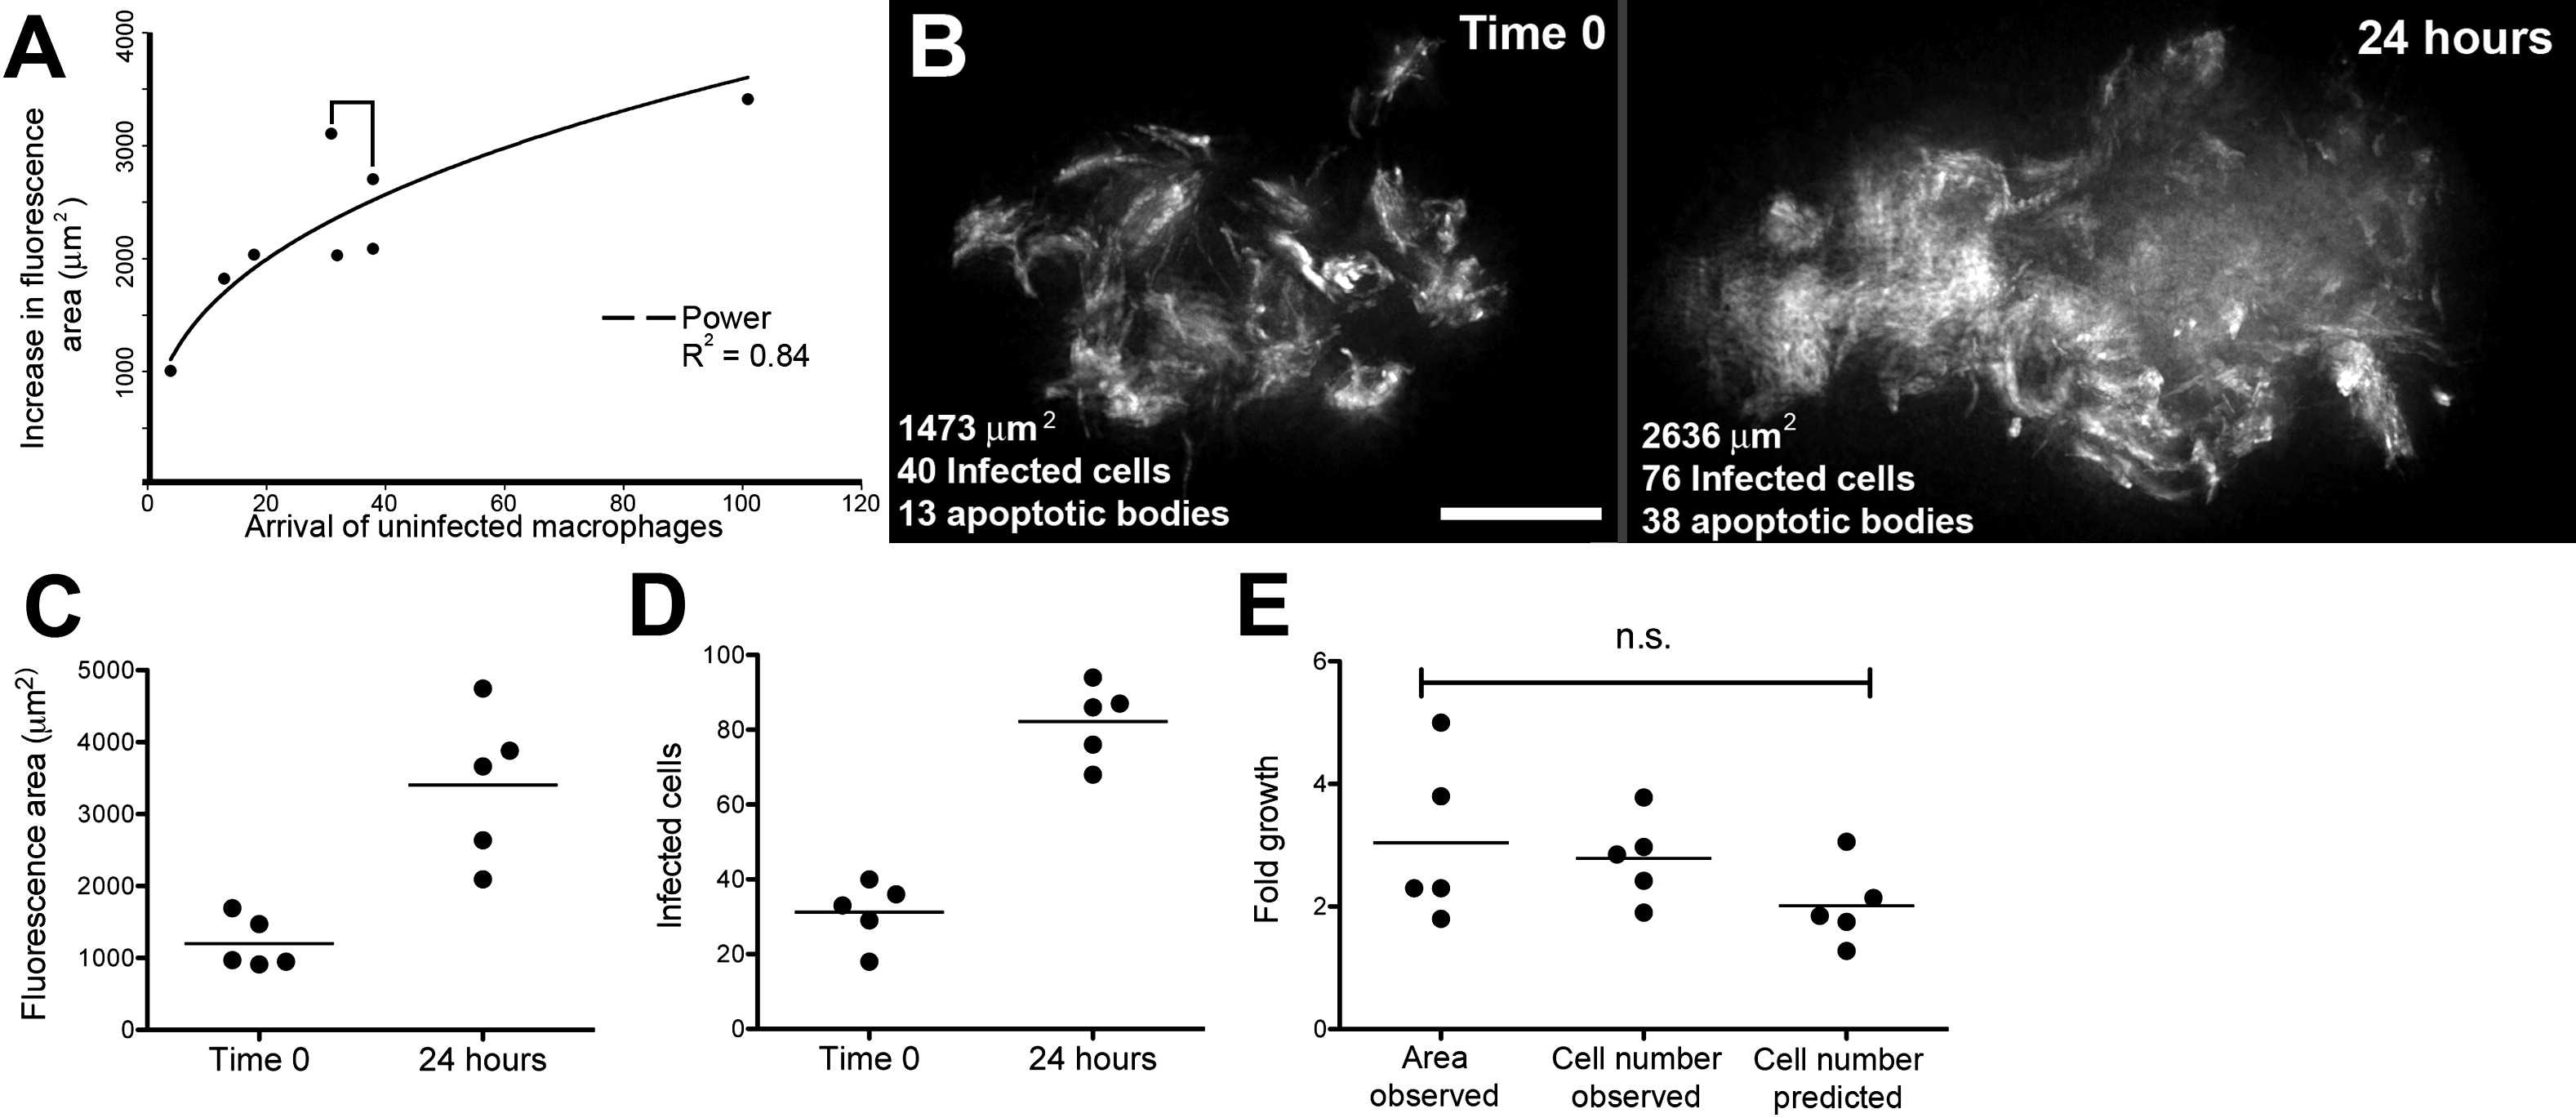
Fig. 4 Bacterial Expansion in Early Granulomas as a Function of Macrophage Arrival, Infection, Death, and Rephagocytosis
(A) Correlation of bacterial growth in granulomas, measured by fluorescence area with arrival of new macrophages. Data from eight granulomas in seven embryos. Bracket indicates pair of granulomas imaged in the same embryo.
(B) Deconvolved fluorescence images of granuloma at time 0 (left) and 24 hr (right). Scale bar, 20 μm.
(C and D) Bacterial expansion in five granulomas over 24 hr as measured by (C) fluorescence area and (D) number of infected cells.
(E) Fold growth as measured in panels (C) and (D) as compared to predicted fold growth based on mathematical modeling. Differences not significant (ANOVA).
Reprinted from Cell, 136(1), Davis, J.M., and Ramakrishnan, L., The role of the granuloma in expansion and dissemination of early tuberculous infection, 37-49, Copyright (2009) with permission from Elsevier. Full text @ Cell