
|
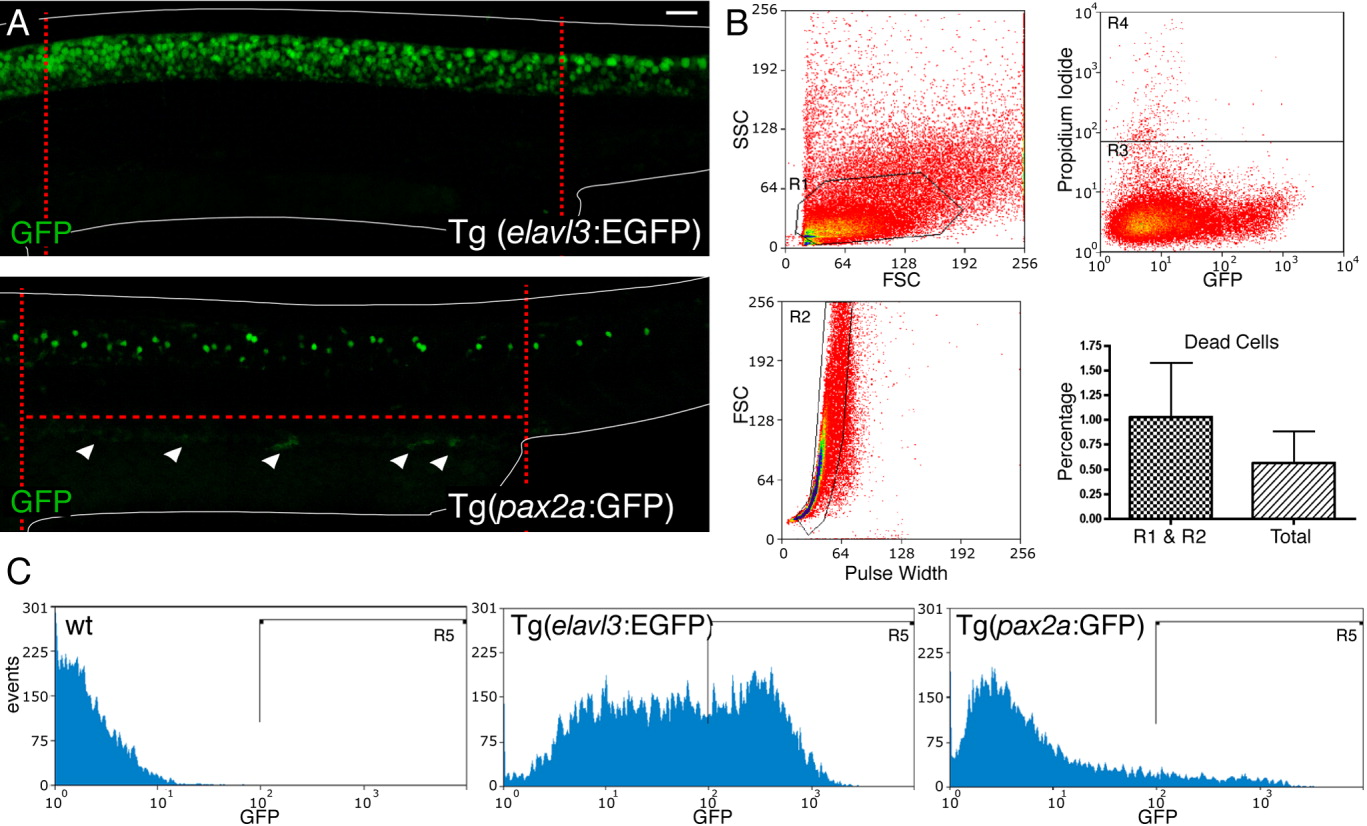
Fig. 1 GFP expression and FAC sorting of Tg(pax2a:GFP) and Tg(elavl3:EGFP) embryos. A: Lateral views of GFP antibody staining (in green) in Tg(elavl3:EGFP) and Tg(pax2a:GFP) trunks at 27 hpf. The edges of the embryos are depicted as white lines. The region dissected from the embryos in our experiments is demarcated with red dotted lines. In this region, at this stage, the vast majority of spinal cord neurons that express GFP in Tg(pax2a:GFP) embryos are CiAs (see also Batista and Lewis,[2008]). White arrowheads in Tg(pax2a:GFP) indicate GFP expression in the pronephros. Scale bar (top left-hand corner of A) = 50 μm. B: Example of: side scatter (SSC) and forward scatter (FCS) measurements used to select a homogenous cell population (R1 area); FCS and pulse width measurements used to select single events (single cells) (R2 area); Propidium Iodide measurement for events from R1 and R2 areas, used to select live cells from the single cells (R3 area); bar chart showing the average percentage of dead cells (R4 area) among the cells from the R1 and R2 area (single cells) and from all events (labelled “Total”). C: Examples of GFP level measurements of single live cells (events present in all three of the R1, R2, and R3 areas) used to select and sort GFP-positive cells from Tg(elavl3:EGFP) and Tg(pax2a:GFP) embryos (R5 area). Trunk samples were selected from the R3 area (live single cells). Wild type (wt) cells were used to calibrate the FACS sorter and set the cut-off for determining the boundary of the R5 area.