
Fig. S2
- ID
- ZDB-IMAGE-090113-25
- Publication
- Matsuda et al., 2009 - Interaction with Notch determines endocytosis of specific Delta ligands in zebrafish neural tissue
- All Figures
- Figures for Matsuda et al., 2009
|
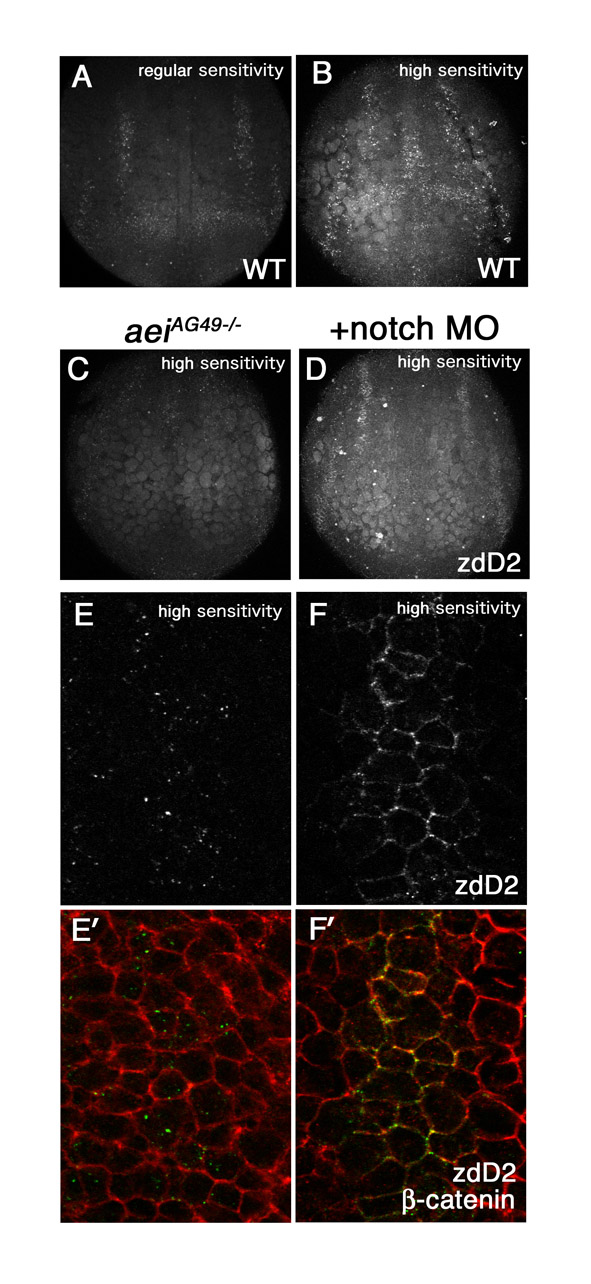
Fig. S2 Notch interaction regulates DeltaA endocytosis. (A,B) Comparison of zdD2 detection with a fluorescent secondary with standard gain used for most cases in this study (A), and with higher gain (B). (C-F′) zdD2 distribution visualized using higher gain in aeiAG49 homozygous embryos (C,E,E′) and in aeiAG49 homozygous embryos co-injected with notch1a and notch3 (D,F,F′). There remains faint zdD2 staining in aeiAG49 homozygous embryos (C), which is easier to see when notch1a and notch3 are knocked down (D). (E-F′) aeiAG49 homozygous embryo with (F,F′) or without (E,E′) notch morpholinos are double stained with zdD2 (grey in E,F, green in E′,F′) and plasma membrane marker β-catenin (red in E′,F′). Magnified images of two longitudinal neurogenic domains in the prospective hindbrain. The setting with high gain was used to take these images. With standard gain there is almost no signal detected in aeiAG49 homozygous embryos. DeltaA remains at the plasma membrane in Notch MO (F,F′).