
Fig. S1
- ID
- ZDB-IMAGE-090113-24
- Publication
- Matsuda et al., 2009 - Interaction with Notch determines endocytosis of specific Delta ligands in zebrafish neural tissue
- All Figures
- Figures for Matsuda et al., 2009
|
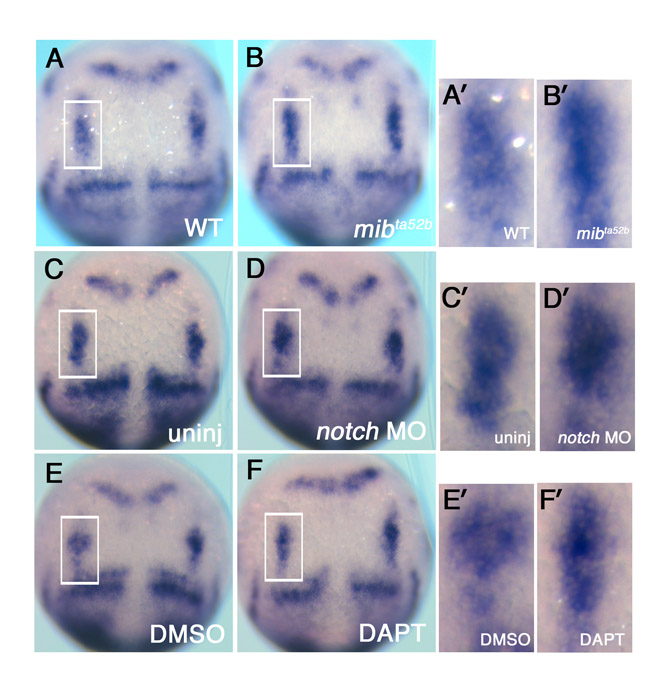
Fig. S1 Comparison of the expression of deltaD transcript following loss of Notch signalling. (A-F′) A comparison of deltaD transcripts in wild-type sibling zebrafish embryos (A,A′) with that in mib mutants (B,B′), in un-injected embryos (C,C′) with Notch MO morphants (D,D′), and in DMSO-treated controls (E,E′) with DAPT treated embryos (F,F′) at the tail bud stage. Accompanying panels on the right (A′-F′) are magnified images of neurogenic domains in hindbrain delineated with rectangles in A-F. deltaD transcripts were not significantly increased at the tail bud stage following reduced Notch signaling.