
Fig. 5
- ID
- ZDB-IMAGE-090113-21
- Publication
- Matsuda et al., 2009 - Interaction with Notch determines endocytosis of specific Delta ligands in zebrafish neural tissue
- All Figures
- Figures for Matsuda et al., 2009
|
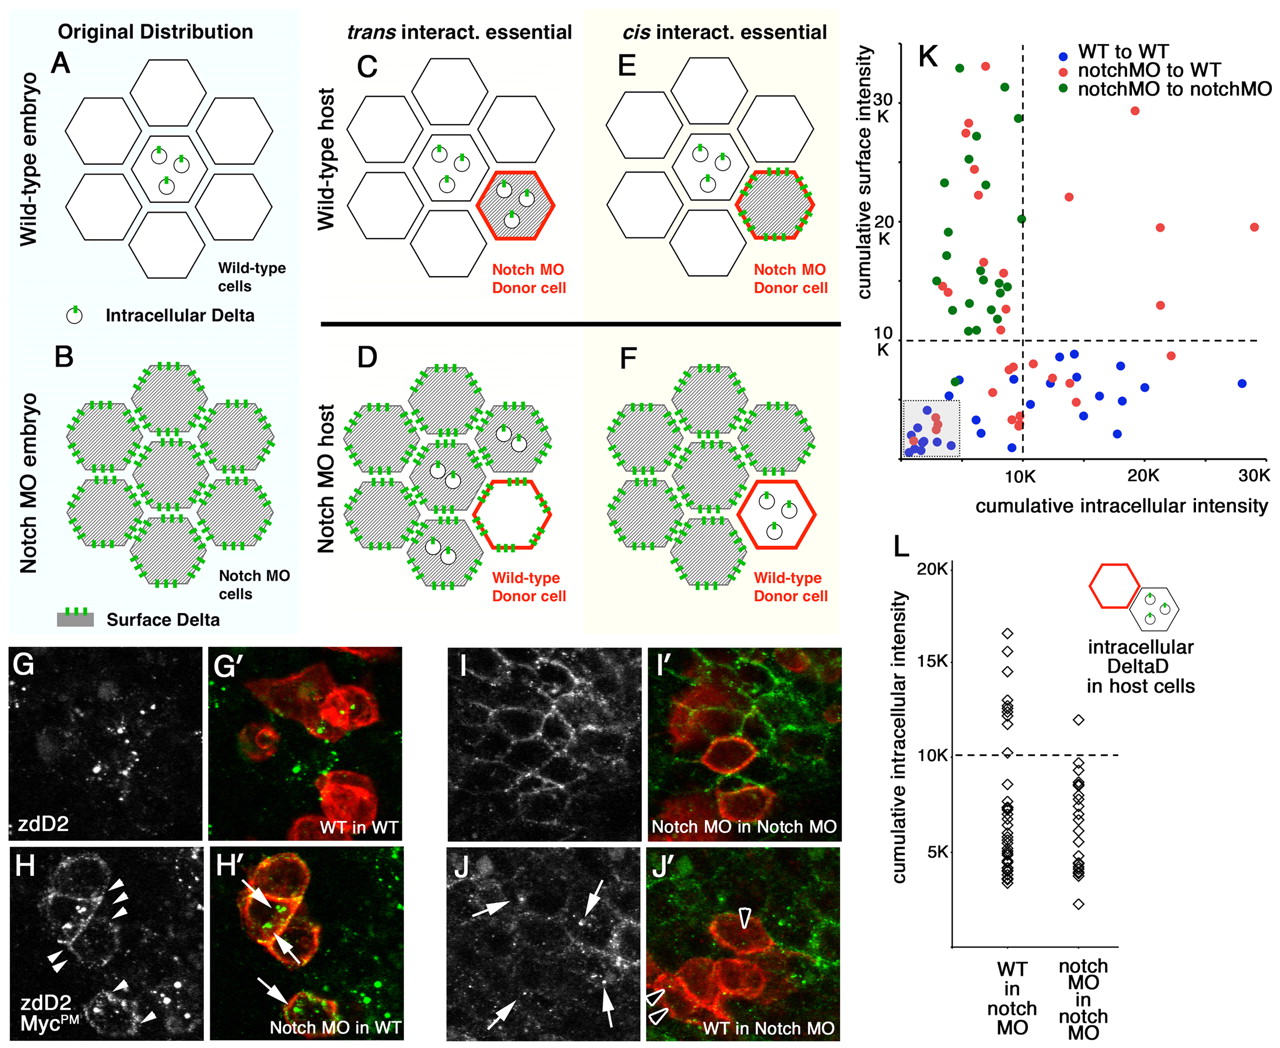
Fig. 5 Delta-Notch interactions in trans and cis contribute to DeltaD endocytosis in zebrafish. (A-F) Schematic of changes in DeltaD distribution expected following transplantation if endocytosis was determined primarily by interactions in trans (C,D) or in cis (E,F). If Notch interactions in `trans' were essential for Delta endocytosis: (C) DeltaD would be in cytoplasmic puncta in Notch MO donor cells in a WT host, (D) DeltaD would accumulate on the cell surface of WT donor cells in Notch MO host, and some Delta would now also be internalized in host Notch MO cells following interaction with Notch in adjacent WT donor cells. If `cis' interactions with Notch were essential for Delta endocytosis: (E) DeltaD would remain on the surface of donor Notch MO cells in a WT host and (F) DeltaD would remain in cytoplasmic puncta in a donor WT cell in Notch MO hosts. (G-J′) Transplantation results. (G,G′) In WT to WT transplants, DeltaD remains in intracellular puncta in WT donor and host cells. (H,H′) In Notch MO to WT transplants, some DeltaD in Notch MO donor cells becomes localized in cytoplasmic puncta (arrows in H′), suggesting that interactions with in trans promote endocytosis. However, some DeltaD remains on the cell surface (arrowheads in H) in Notch MO donor cells, suggesting an additional requirement for interactions in cis. (I,I′) In Notch MO to Notch MO transplants, DeltaD remains on the cell surface in Notch MO donor cells in Notch MO hosts. (J,J′) In WT to Notch MO transplants, some adjacent Notch MO host cells now show DeltaD in cytoplasmic puncta (arrows in J), suggesting DeltaD endocytosis following interactions in trans. Observation of cytoplasmic DeltaD puncta in WT donor cells in Notch MO hosts (black arrowheads in J′) suggest Notch interactions in cis contribute to DeltaD endocytosis. (K,L) Quantitative analysis. Cumulative pixel intensity within the cell or at the cell surface, representing the fluorescence of a secondary antibody recognizing zdD2, was measured in individual cells to quantify the distribution of DeltaD protein. Each spot represents an individual cell. (K) Scatter plot of relative intracellular (x-axis) versus cell surface (y-axis) distribution in transplanted cells from WT to WT (blue), Notch MO to Notch MO (green) and Notch MO to WT (red). The broken line indicates 10 K units and the area below 5 K units is shadowed. (L) Cumulative intracellular intensity in Notch MO host cells adjacent to WT transplants and Notch MO host adjacent to Notch MO transplants.