
Fig. 1
- ID
- ZDB-IMAGE-090109-1
- Genes
- Publication
- Quarto et al., 2008 - Temporal and spatial expression of RNases from zebrafish (Danio rerio)
- All Figures
- Figures for Quarto et al., 2008
|
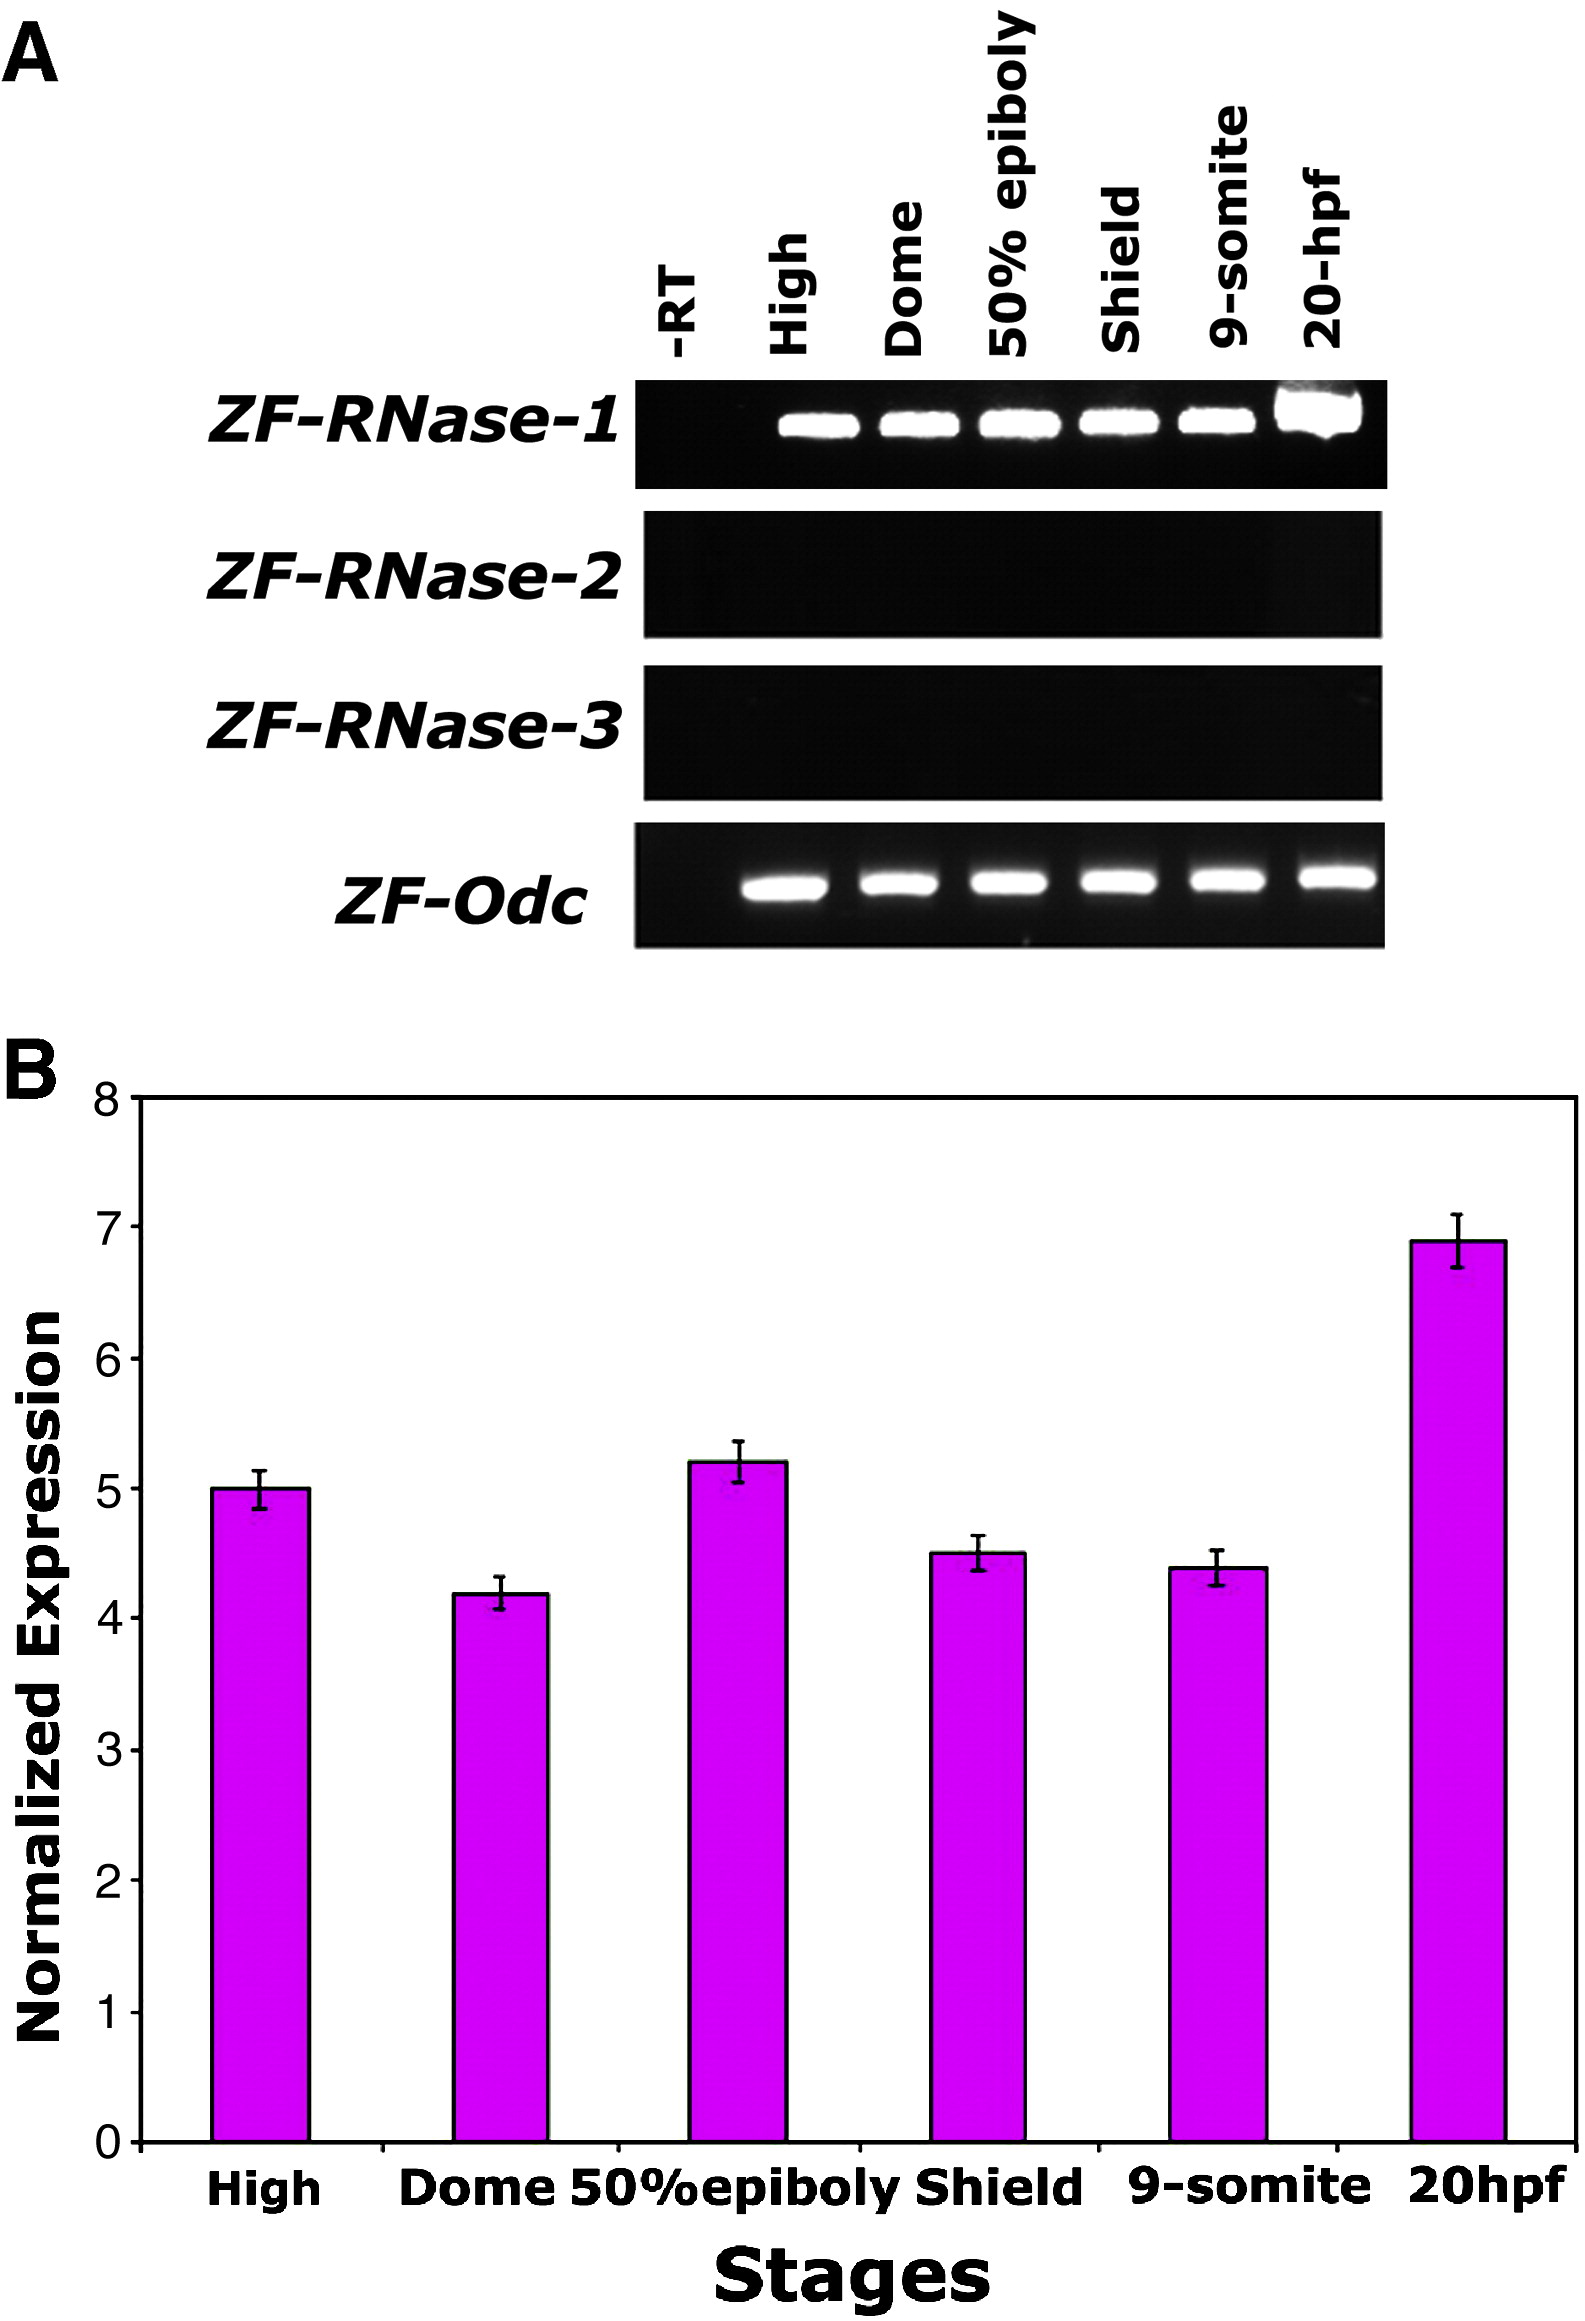
Fig. 1 Temporal expression of ZF-RNases-1, -2 and -3 during zebrafish embryos development. A, zebrafish embryos at different stages were analyzed by reverse transcriptase followed by PCR (RT-PCR) for the expression of ZF-RNases-1, -2 and -3 genes. The -RT lane is a negative control for the reverse transcription reaction. ZF-Odc is a loading control. B, quantitative analysis of ZF-RNases-1gene was performed by real-time PCR. Quantitative real-time PCR correlated with the above results. Both analysis show that during embryonic development ZF-RNases-1 is the only gene expressed. Quantified mRNA values were normalized by the amounts of ZF-Odc mRNA, the house keeping gene, and results are given as fold induction. Abbreviations used: (hpf), hours post-fertilization, (ZF-Odc), ornithine decarboxylase.
Reprinted from Gene, 427(1-2), Quarto, N., Pizzo, E., and D'Alessio, G., Temporal and spatial expression of RNases from zebrafish (Danio rerio), 32-41, Copyright (2008) with permission from Elsevier. Full text @ Gene