
Fig. S5
- ID
- ZDB-IMAGE-081222-34
- Publication
- Waxman et al., 2008 - Hoxb5b acts downstream of retinoic Acid signaling in the forelimb field to restrict heart field potential in zebrafish
- All Figures
- Figures for Waxman et al., 2008
|
Fig. S5
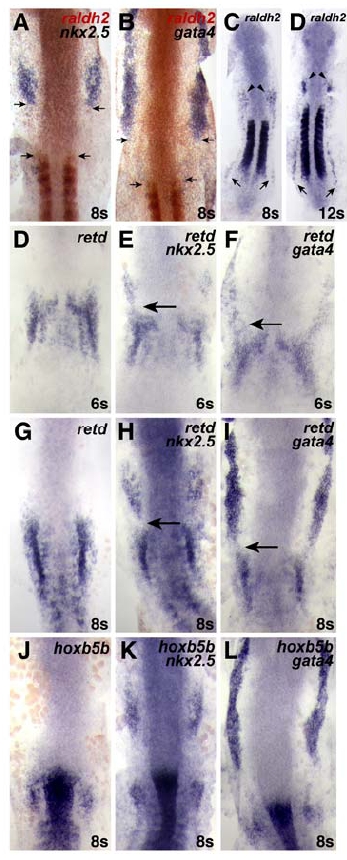
Comparison of the Expression Patterns of nkx2.5, gata4, retd, hoxb5b, and raldh2
Dorsal views, anterior to the top.
(A and B) nkx2.5 (blue in A) and gata4 (blue in B) are expressed at a distance from raldh2 (red-brown) in the somites at the 8 somite stage.
(C and D) At the 8 and 12 somite stages, after the requirement for RA signaling to limit cardiac cell number has primarily passed (Figures 1D and 1E), there are low levels of raldh2 expression in the posterior LPM (arrows) and the otic vesicles (arrowheads). The staining reaction for these particular in situ hybridizations ran significantly longer than all others represented in our figures. Prior to the 8 somite stage, even particularly long staining reactions did not reveal raldh2 expression in the LPM, consistent with prior reports (Begemann et al., 2001; Grandel et al., 2002; JSW and DY, unpublished data).
(D–F) At the 6 somite stage, when robust expression of nkx2.5 and gata4 begins, these genes are found just anterior to the RA-responsive gene retd. Arrows in (E,F) indicate the anterior limit of retd expression.
(G–I) By the 8 somite stage, expression of cardiac marker genes nkx2.5 and gata4 is separated from retd expression. Arrows in (H,I) indicate the space between expression domains.
(J–L) At the 8 somite stage, expression of nkx2.5 and gata4 is at a distance from hoxb5b expression.
Reprinted from Developmental Cell, 15(6), Waxman, J.S., Keegan, B.R., Roberts, R.W., Poss, K.D., and Yelon, D., Hoxb5b acts downstream of retinoic Acid signaling in the forelimb field to restrict heart field potential in zebrafish, 923-934, Copyright (2008) with permission from Elsevier. Full text @ Dev. Cell