
Fig. 3
- ID
- ZDB-IMAGE-081218-3
- Genes
- Publication
- de Campos-Baptista et al., 2008 - Nodal signaling promotes the speed and directional movement of cardiomyocytes in zebrafish
- All Figures
- Figures for de Campos-Baptista et al., 2008
|
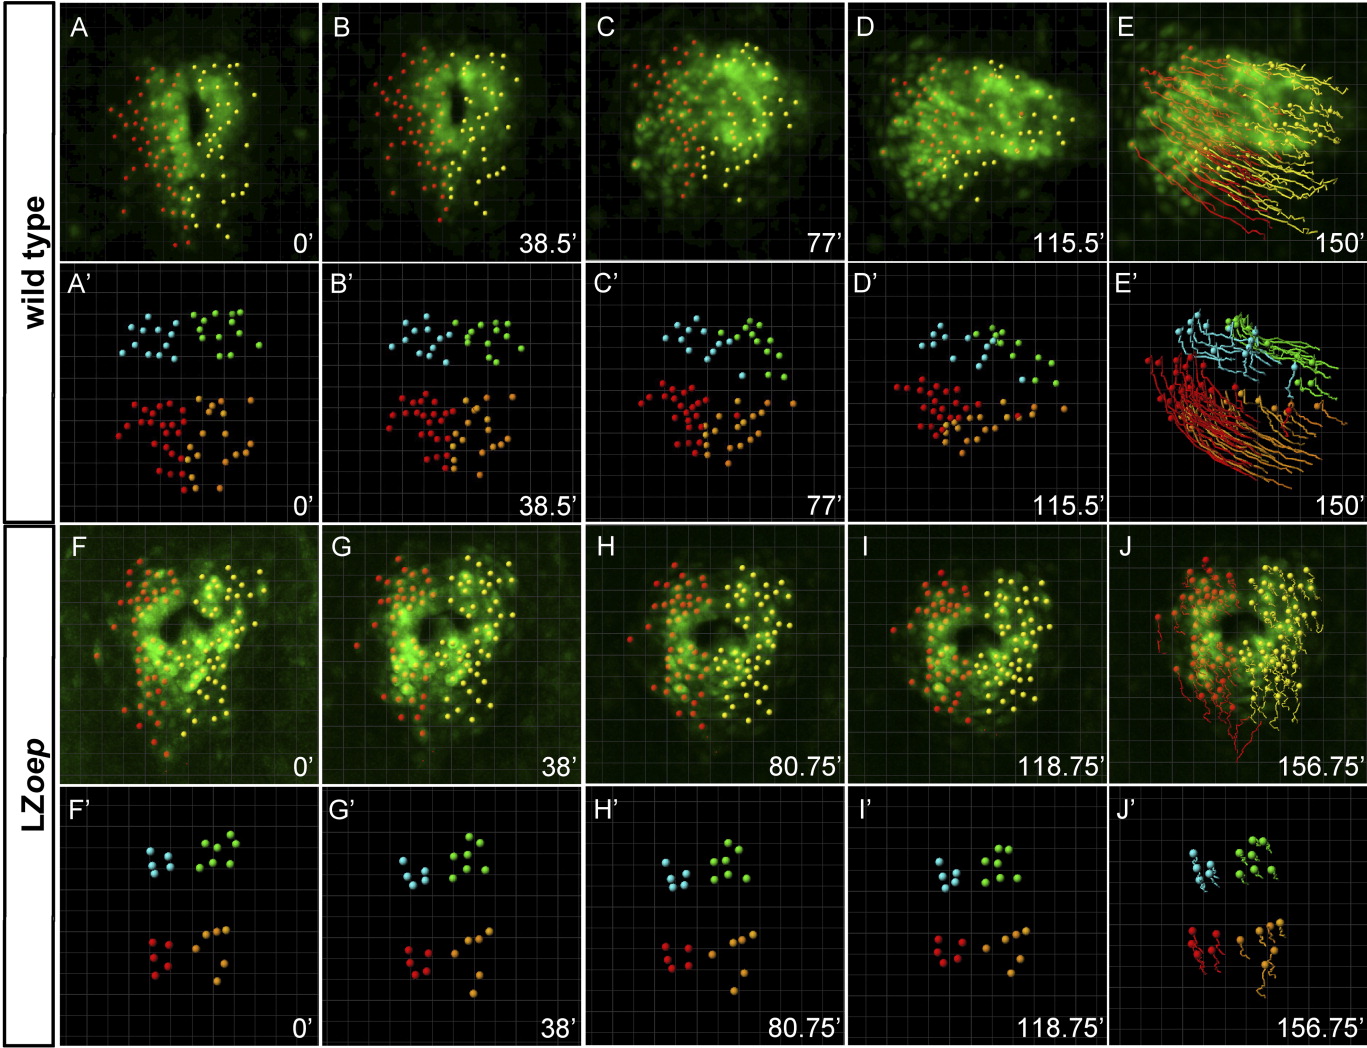
Fig. 3 Tracking of single cells in wild type and LZoep mutants. Confocal 3D-images showing individual cmlc2-GFP cells that were manually tracked starting at the onset of cardiac cone formation. First (A-E) and third (F-J) rows: green cmlc2-GFP expression; red: cells within the left side of cardiac cone; yellow: cells within the right side of cardiac cone. For detailed views from different angles, see Supplemental Movies 1 (wild type) and 5 (LZoep). Second (A′-E′) and fourth (F′-J′) rows: tracking of quadrants. Quadrants were defined by grouping left-anterior cells (blue), left-posterior cells (red), right anterior cells (green), and right-posterior cells (orange). For detailed views from different angles, see Supplemental Movies 3 (wild type) and 7 (LZoep). Pictures were cropped to keep the heart in the center and do not maintain the position of the coordinate systems. For movements with respect to coordinate systems, see Supplemental Movies 3 (wild type) and 7 (LZoep).