
Fig. 3
- ID
- ZDB-IMAGE-081022-23
- Publication
- García-Lecea et al., 2008 - In vivo Analysis of Choroid Plexus Morphogenesis in Zebrafish
- All Figures
- Figures for García-Lecea et al., 2008
|
Fig. 3
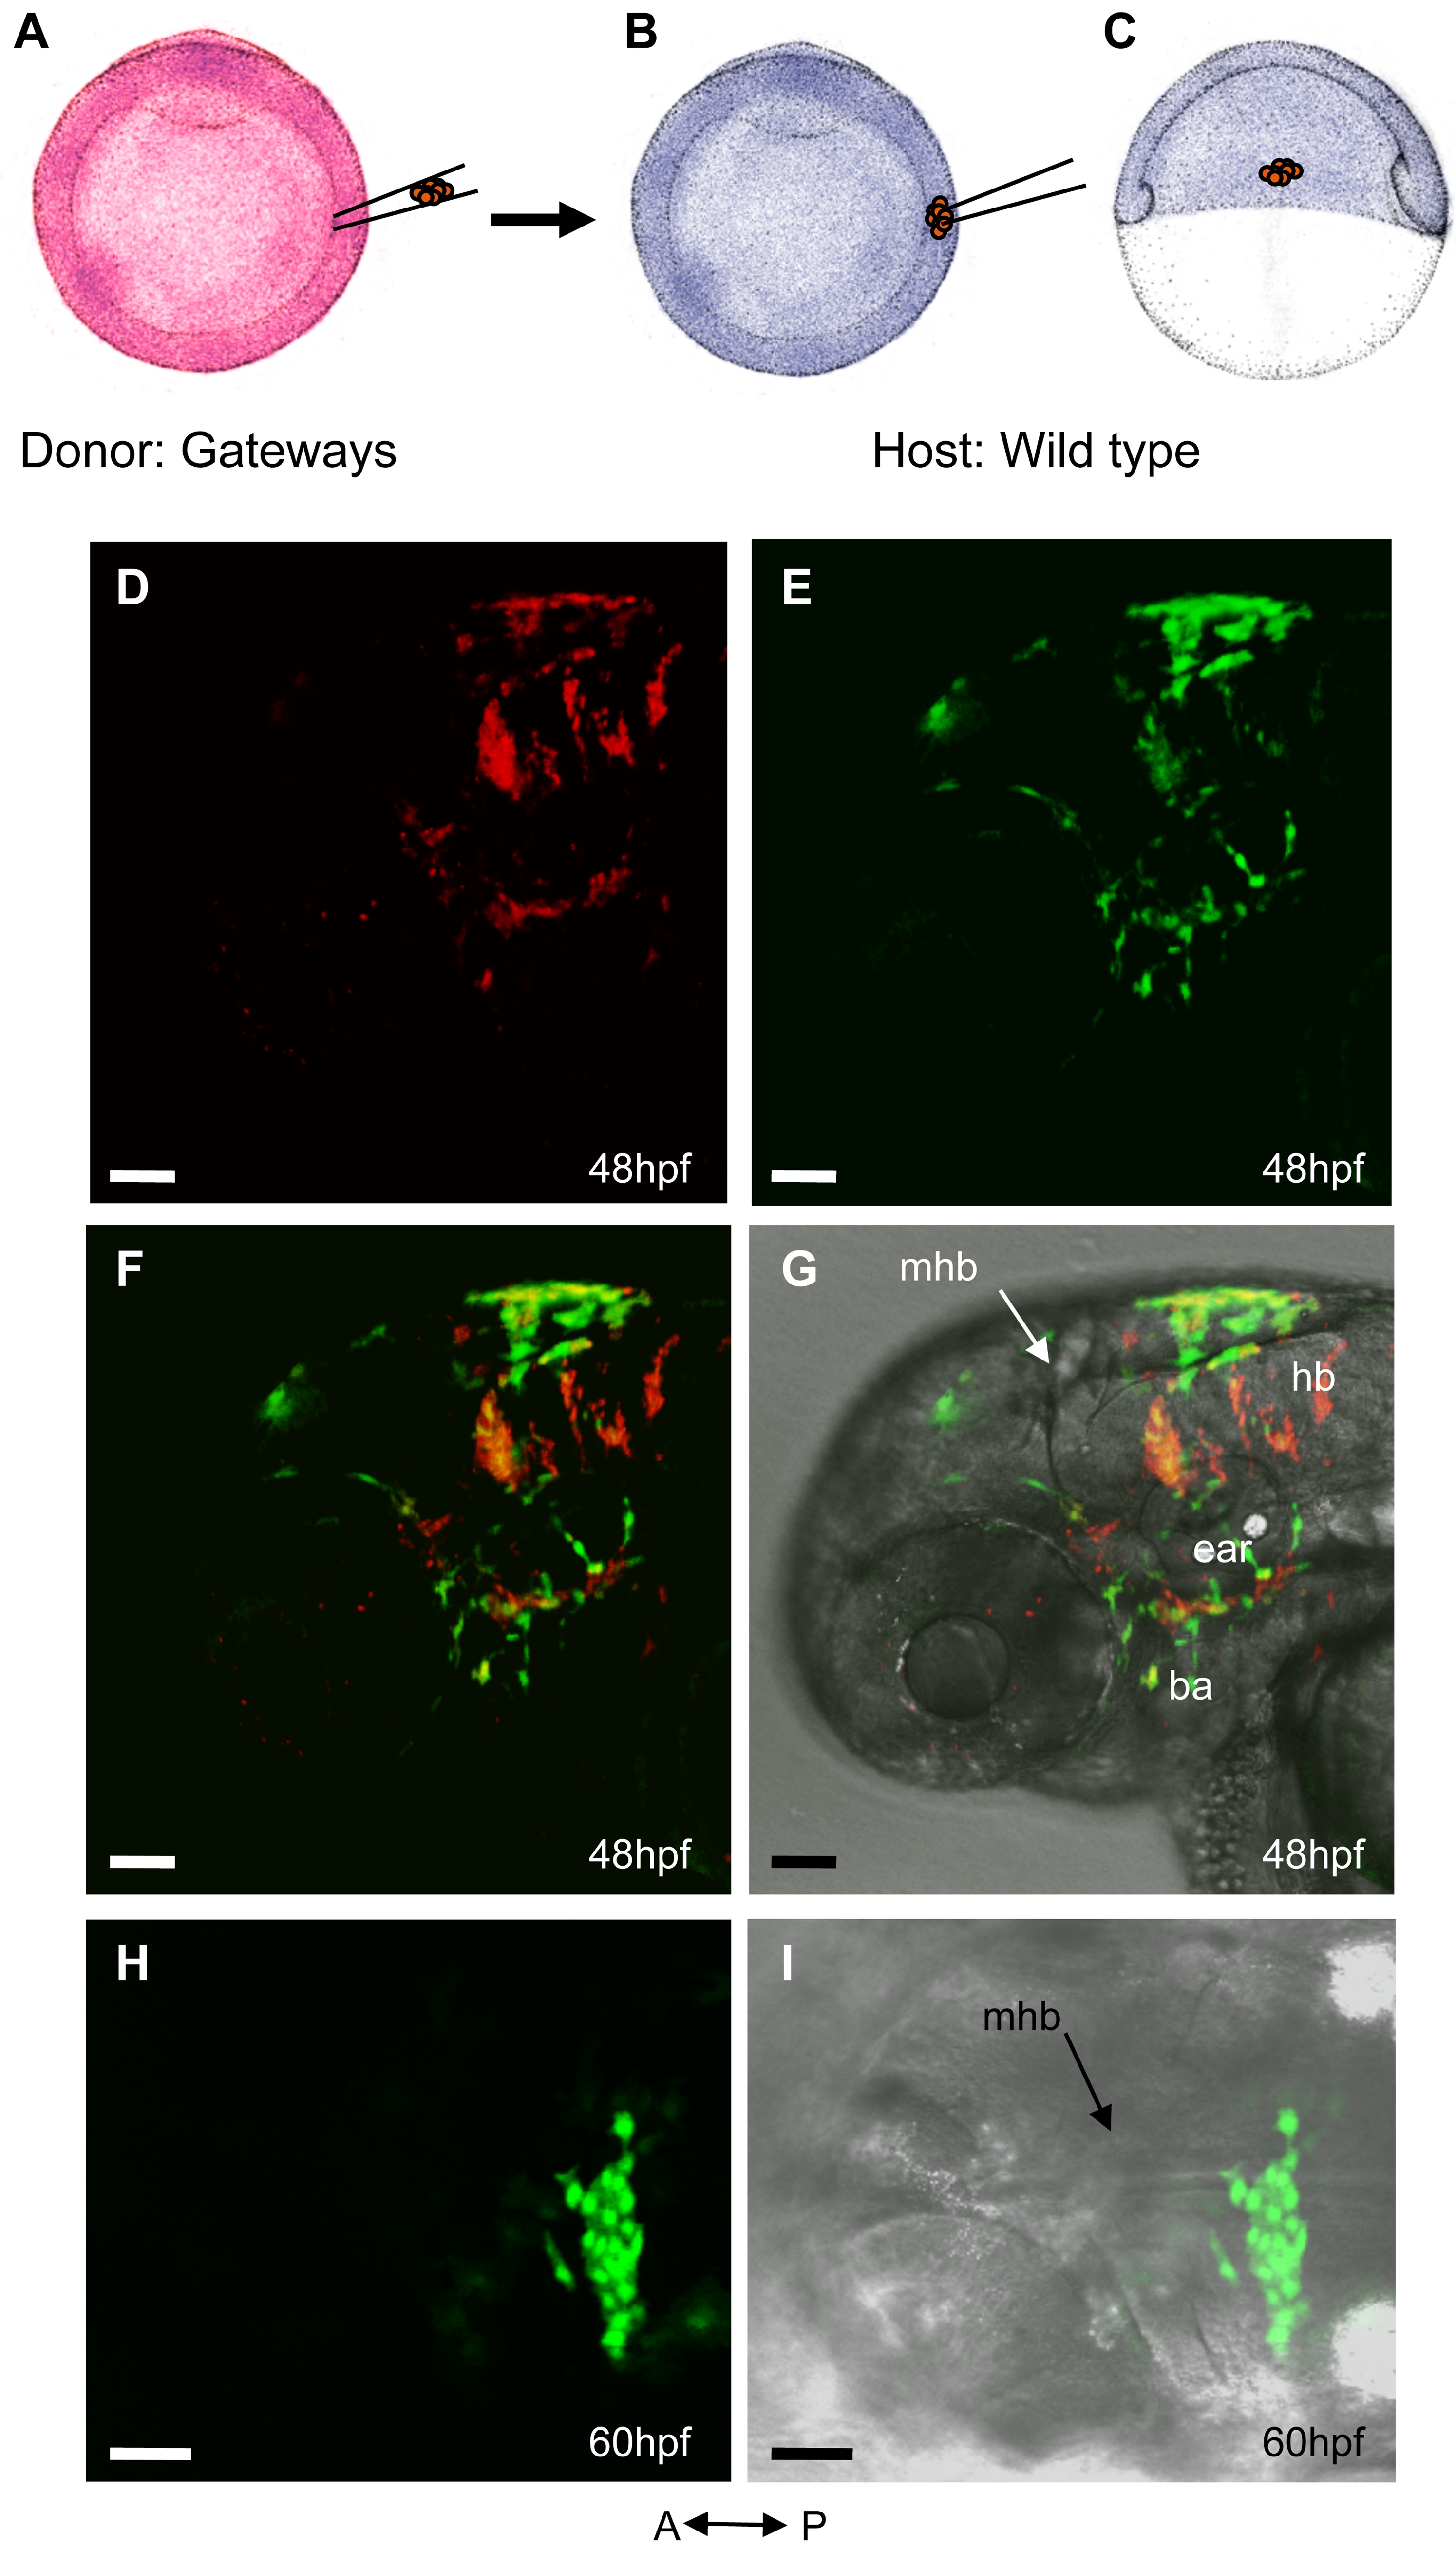
Lineage analysis of ChP.
Transplantation was performed at 6hpf and the outcome was visualized at 48hpf (n = 5) and 60hpf (n = 4). A–C, schematic of the transplantation experiment. A,B, drawing of the animal view of 6hpf embryos. C, drawing of the lateral view of a 6hpf embryo. A, Texas Red-injected Gateways donor. B,C, wild type host. D–G, lateral view of 48hpf host embryo. D, Texas Red-labelled descendants of transplanted cells. E, GFP positive descendants of transplanted cells. F, merged D&E. G, merged F & bright field image. H,I, dorsal view of 60hpf host embryo. H, cluster of GFP-positive cells in the roof of fourth ventricle. I, merged H & bright field image. Abbreviations: ba – branchial arch, hb – hindbrain, mhb - midbrain-hindbrain boundary.