
Fig. 2
- ID
- ZDB-IMAGE-081021-210
- Publication
- Snow et al., 2008 - Time-lapse analysis and mathematical characterization elucidate novel mechanisms underlying muscle morphogenesis
- All Figures
- Figures for Snow et al., 2008
|
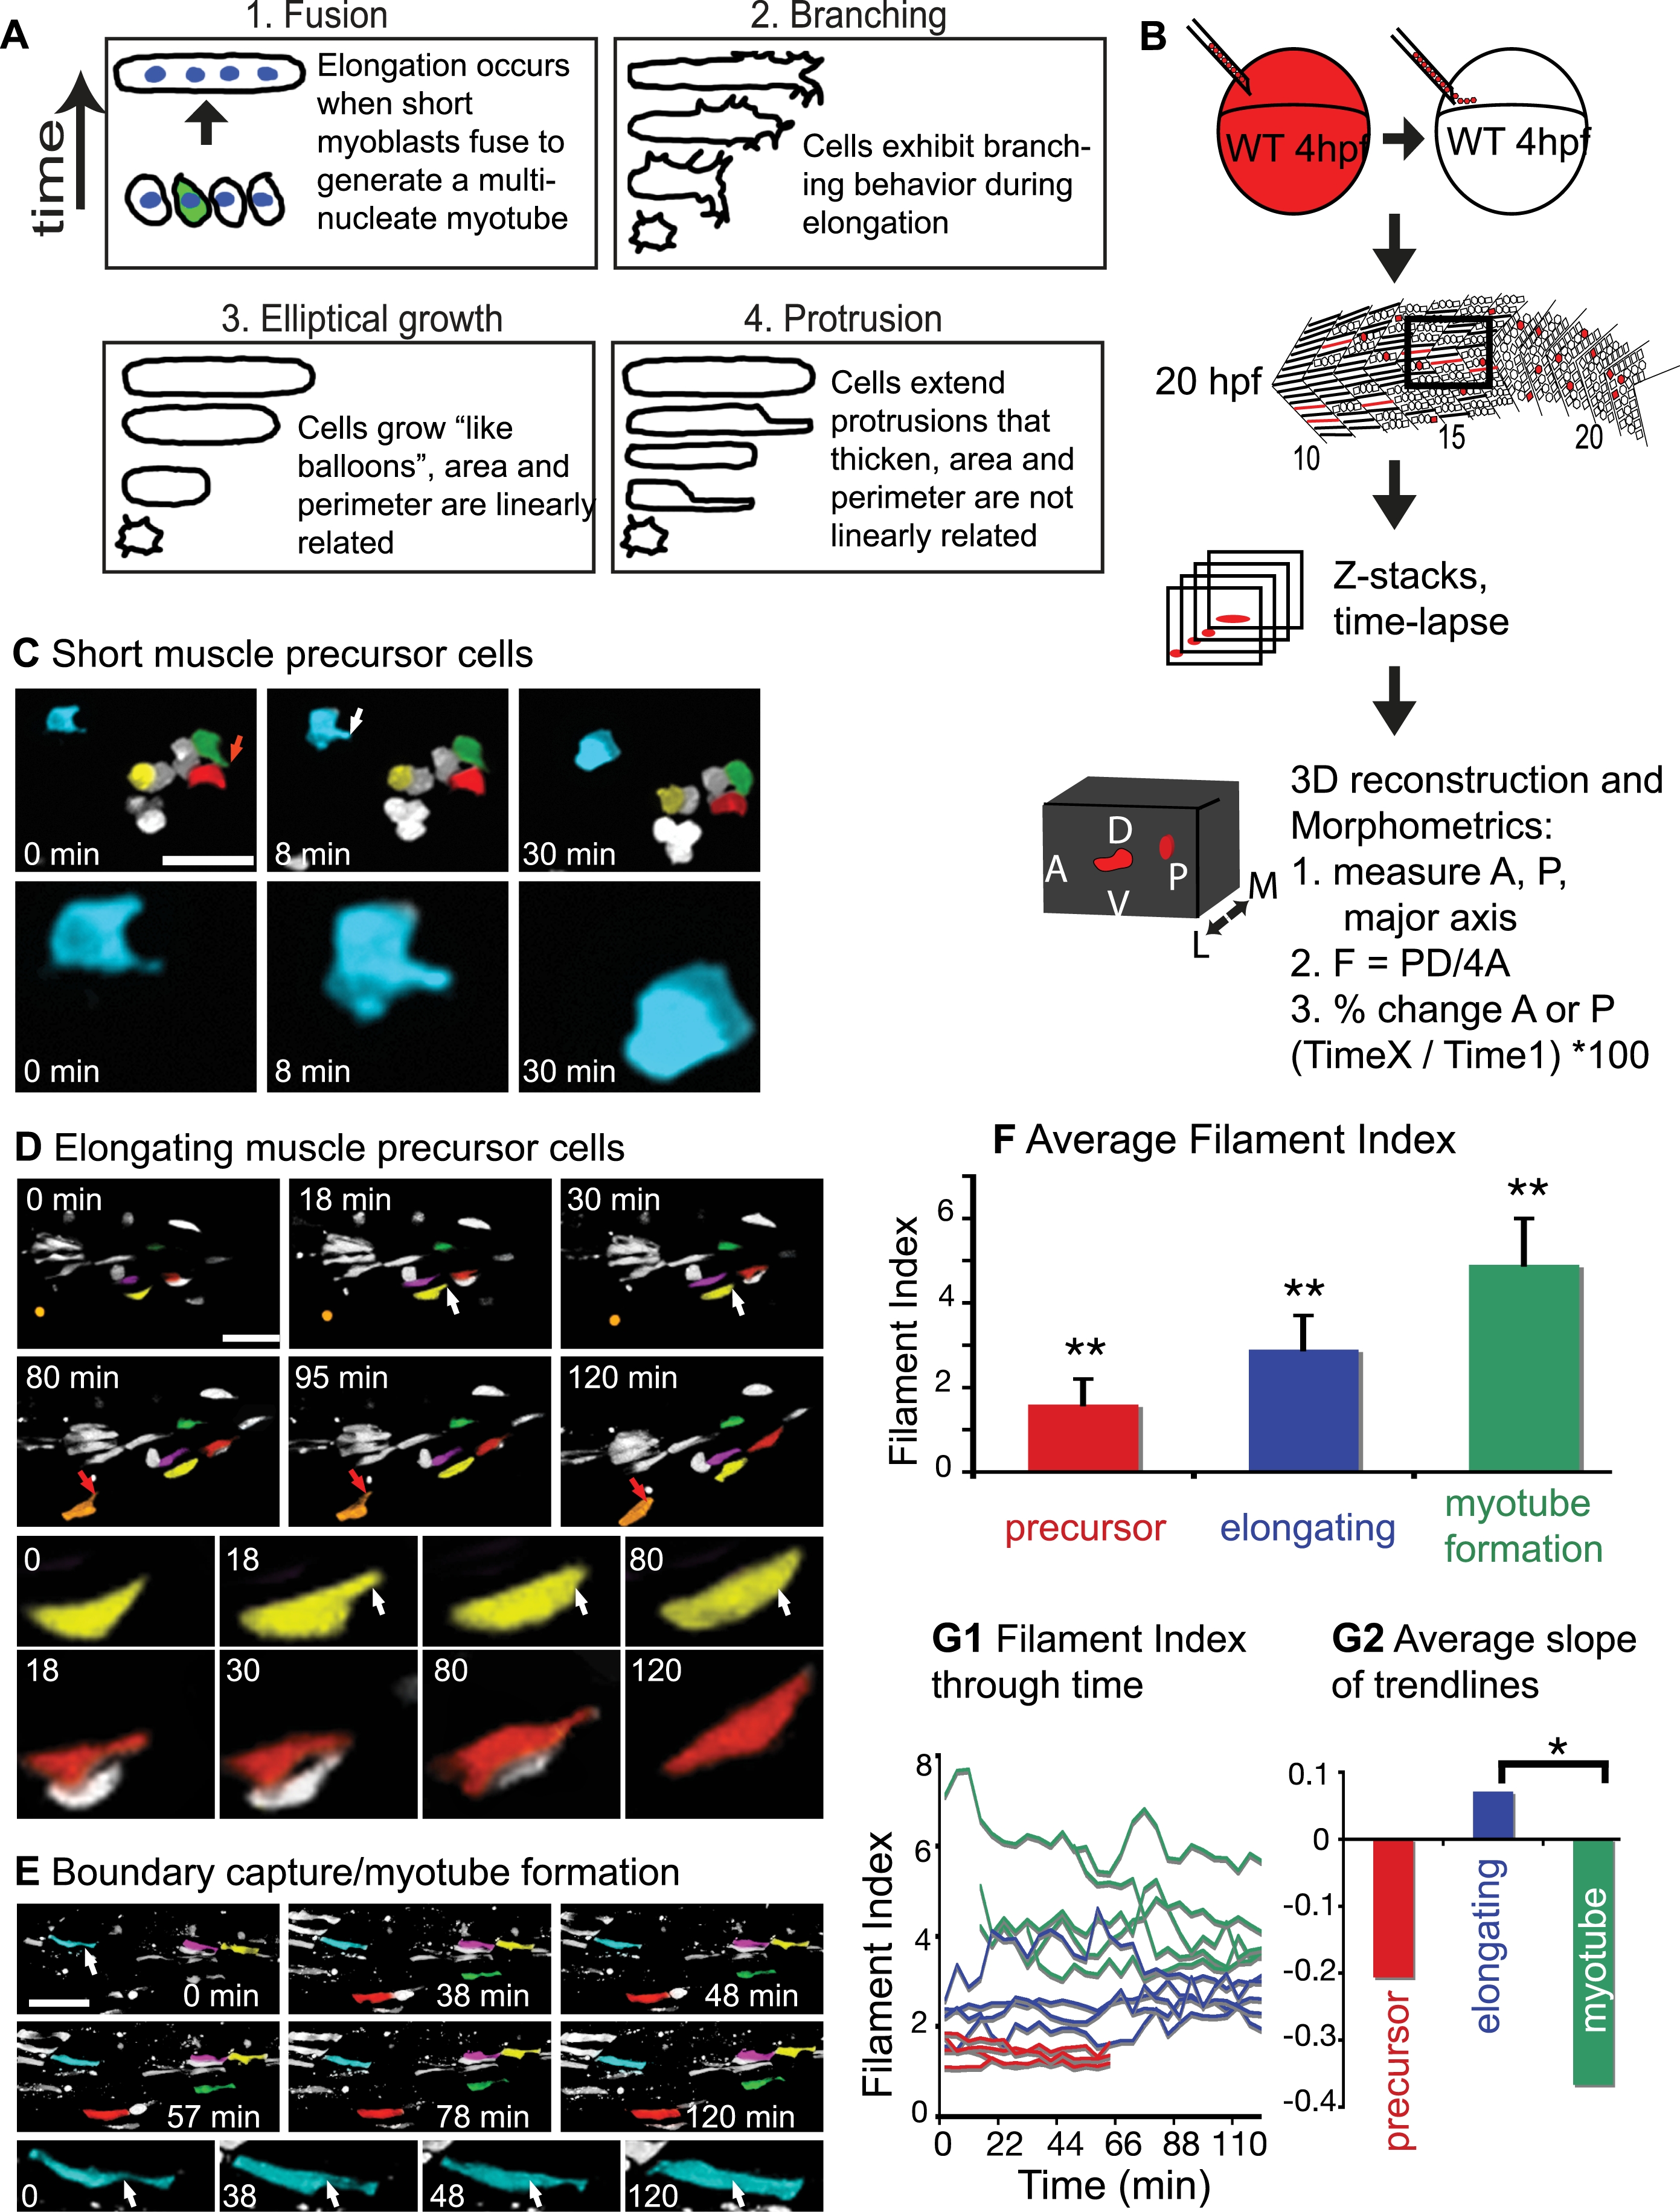
Fig. 2 Three Phases of Muscle Morphogenesis: Short Muscle Precursor Cells, Intercalation/Elongation, and Boundary Capture/Myotube Formation.
(See also Movie S3.) Projections of ApoTome micrographs are shown, side views, anterior left, dorsal top. Cells were pseudocolored to facilitate visualization. A) Cartoon depicting possible scenarios for elongation of myofibers. B) Cartoon depiction of the methods used. Dextran filled WT cells (red) were transplanted into an unlabeled embryo at the blastula stage, time-lapse data was collected at 20 hpf, then Z-stacks were three dimensionally projected for morphometric analysis. C) Short muscle precursor cells do not undergo large-scale shape changes. A 21 somite-stage embryo, approximate location of somite 15 at left. The blue cell extends a filopodia-like protrusion (8 min, white arrow) that is then retracted (30 min, the blue cell is enlarged in the bottom panels). The protrusion in the green cell (red arrow at 0 min) is also retracted by 30 min. D) Elongating muscle precursor cells extend protrusions along their major axis as they elongate. A 22 somite-stage embryo, somite 18 at left. The yellow cell extends a long, thin protrusion (white arrow) at 18 min that increases in thickness, resulting in a longer cell. The orange cell extends a protrusion (red arrow) at 80 min that becomes thicker by 120 min. E) Myotube formation involves the transition from an irregularly shaped cell to a more homogenously shaped tube. At 0 min, the blue cell with a white arrow is not yet tube-shaped, i.e. part of the cell is significantly narrower than the other parts (white arrow). Over time, the narrow portion thickens, eventually generating a long tube-shaped myotube (120 min, white arrows in bottom enlarged panels are in the same location in all panels). F) The filament index is significantly different between the three phases (**, p<0.01). G1) The filament index of the three phases through time. G2) Average slopes of linear trendlines from data in G1 (*, p<0.05).