
Fig. 1
- ID
- ZDB-IMAGE-081021-160
- Publication
- Kishi et al., 2008 - The identification of zebrafish mutants showing alterations in senescence-associated biomarkers
- All Figures
- Figures for Kishi et al., 2008
|
Fig. 1
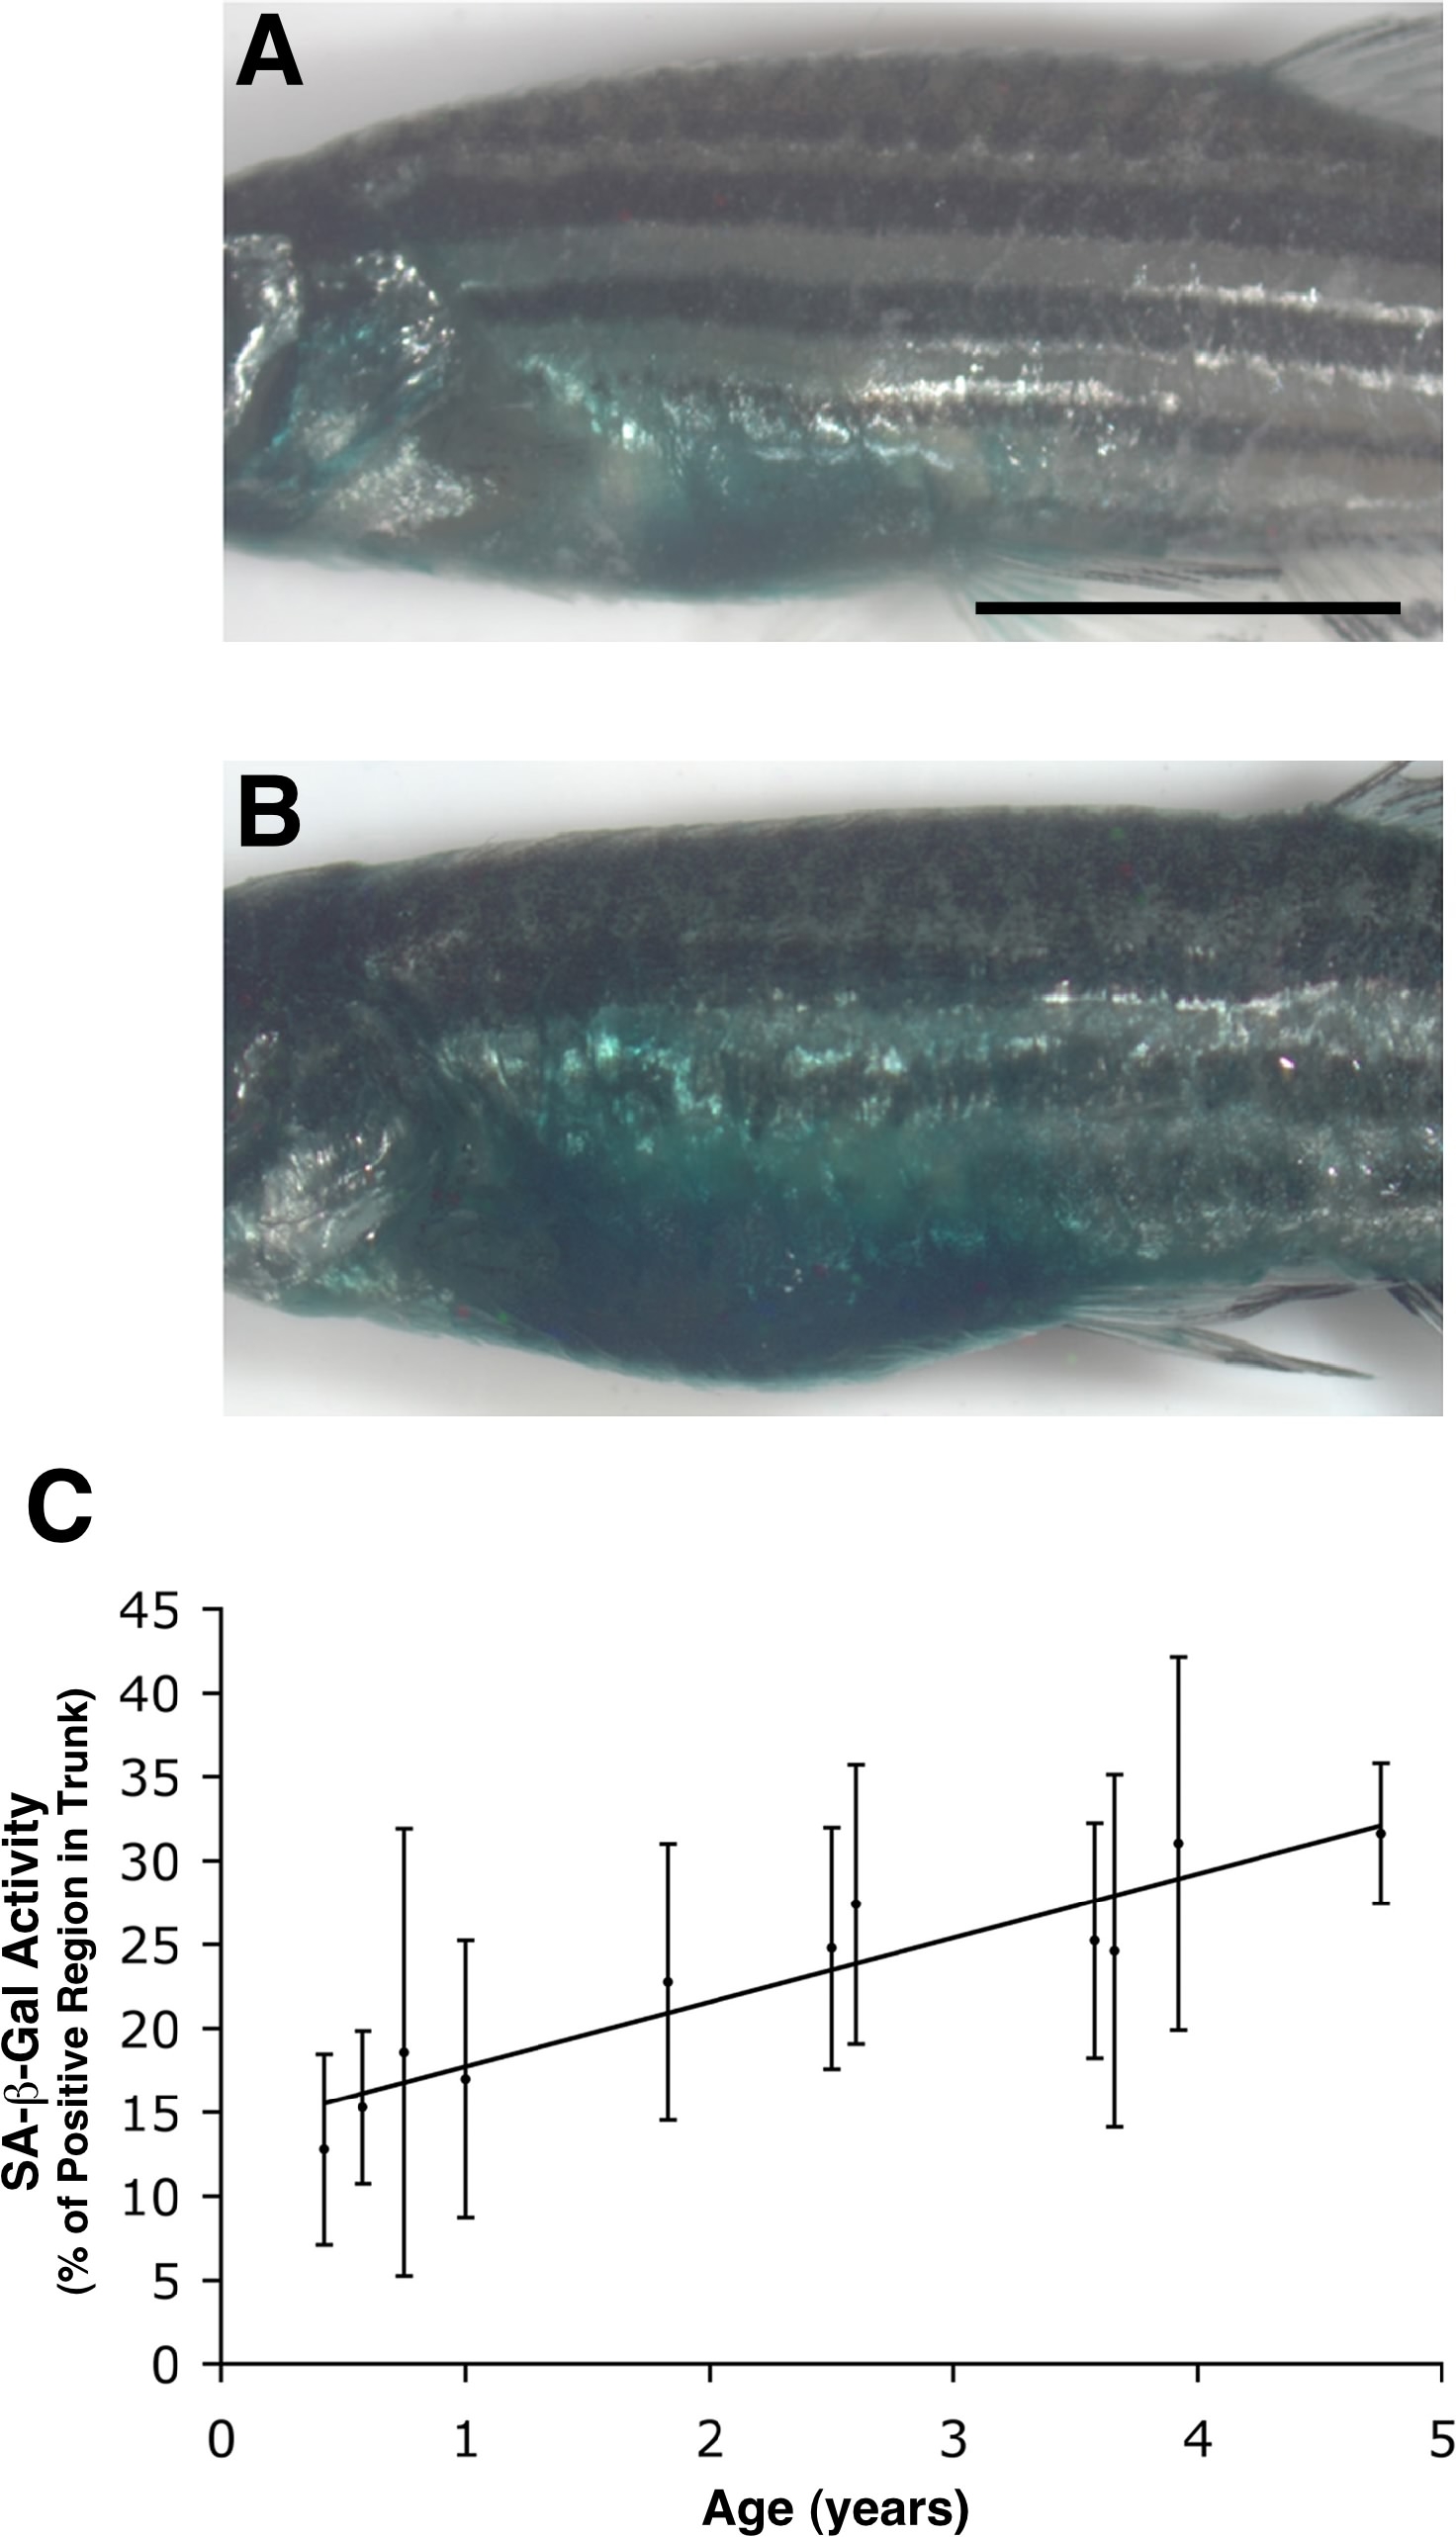
SA-β-gal activity in the trunk skin of the adult zebrafish increases with age.
(A, B) Lateral imaging of 5-month (0.42 y) old (A) and 57-month (4.75 y) old (B) whole adult zebrafish stained for SA-β-gal activity. (C) Quantitative analysis of trunk SA-β-gal staining in fish of various ages showing a near-linear increase in SA-β-gal activity with age. Quantitation was done via image analysis using Adobe Photoshop as described in Materials and Methods and documented in the Supporting Information (Figure S1). The numbers of fish at each time point (years) were: 0.42 y (n = 16); 0.58 y (n = 14); 0.75 y (n = 13); 1 y (n = 14); 1.83 y (n = 15); 2.5 y (n = 6); 2.6 y (n = 8); 3.58 y (n = 14); 3.66 y (n = 12); 3.92 y (n = 22); 4.75 y (n = 5). R2 = 0.3027. y; year(s) of age. (Scale bar: 0.5 cm.)