
|
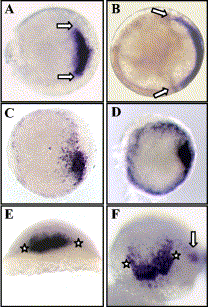
Fig. 6 Expanded and ectopic chordin domains in PI-inhibited embryos. Expression pattern of chordin at 50% epiboly in PI-inhibited embryos. Animal pole view with dorsal to the right (A–D). (A) Wild-type embryo, arrows denote the lateral domain of chordin expression. Embryo treated with (B) IP3R inhibitor (XeC) with arrows showing expanded chordin domain. (C) L-690,330-injected and (D) thapsigargin-treated embryos with radialized chordin expression. Dorsal view of (E) Control (10 mM L-690,330 + 50 mM myo-inositol-injected) embryo with a relatively normal chordin expression domain (stars) and of (F) L-690,330-injected embryo with an ectopic domain, arrow.
Reprinted from Developmental Biology, 259(2), Westfall, T.A., Hjertos, B., and Slusarski, D.C., Requirement for intracellular calcium modulation in zebrafish dorsal-ventral patterning, 380-391, Copyright (2003) with permission from Elsevier. Full text @ Dev. Biol.