
|
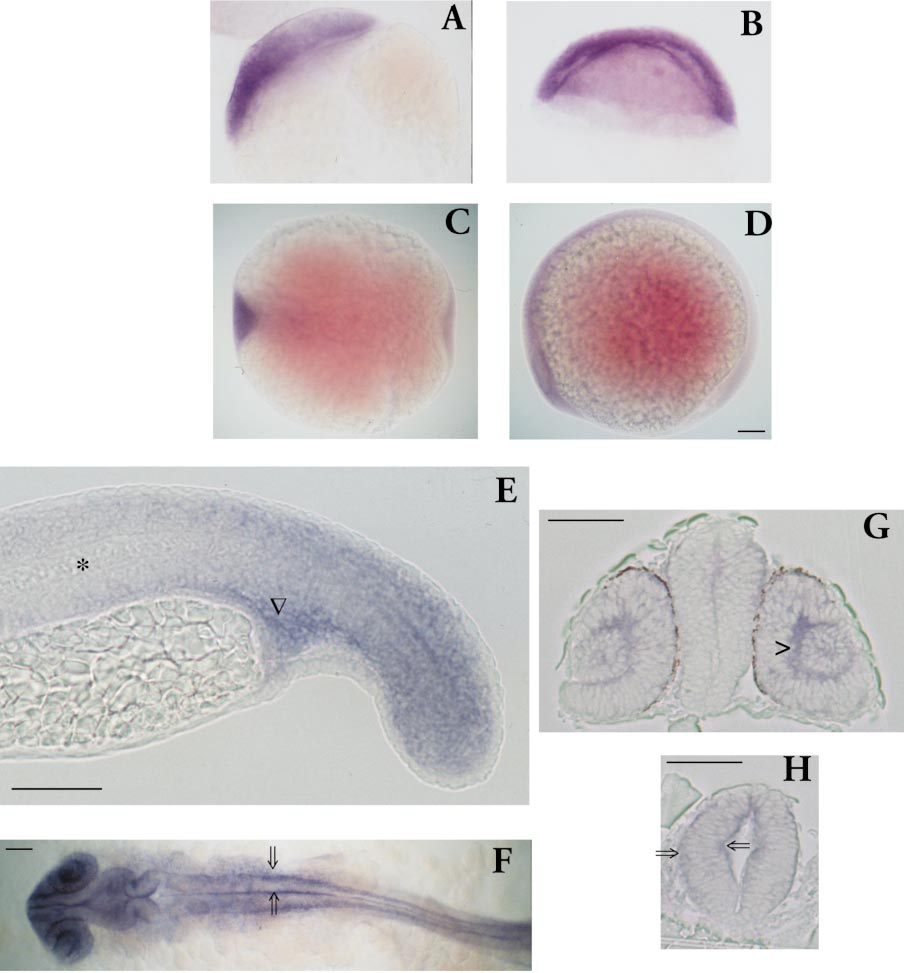
Fig. 4 Expression of hsp90β in zebrafish embryos as detected by in situ hybridization analysis. (A) Sphere stage. (B) 30% epiboly. (C and D) Bud stage. (E–H) 20 h. (A, B, D, and E) Lateral view. (C) Ventral view. (F) Dorsal view. (G and H) Cross section through the forebrain and midbrain regions, respectively. hsp90β expression is widespread in blastula-stage embryos (A and B). During late gastrulation and early somitogenesis, hsp90β mRNA is detectable predominantly in the anterior structures of the embryo (C and D). At 20 h of development, the strongest expression of hsp90β is within the CNS, particularly in cells along the central canal and the exterior margins (open arrows in F and H) as well as the developing retina (G). In addition, moderate expression is observed in the tail bud and in cells immediately caudal to the yolk ball extension (triangle in E). No hsp90β mRNA is detectable in the notochord (asterisk in E). Scale bar, 100 μm.
Reprinted from Developmental Biology, 210(1), Lele, Z., Hartson, S.D., Martin, C.C., Whitesell, L., Matts, R.L., and Krone, P.H., Disruption of zebrafish somite development by pharmacologic inhibition of hsp90, 56-70, Copyright (1999) with permission from Elsevier. Full text @ Dev. Biol.