
Fig. S5
- ID
- ZDB-IMAGE-081007-29
- Genes
- Publication
- Mudumana et al., 2008 - odd skipped related1 reveals a novel role for endoderm in regulating kidney versus vascular cell fate
- All Figures
- Figures for Mudumana et al., 2008
|
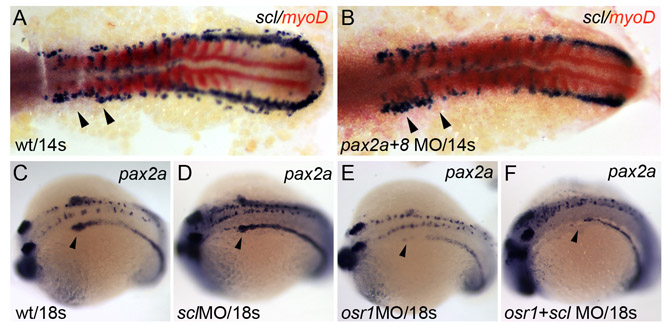
Fig. S5 Intermediate mesoderm patterning in pax2/8 and scl morphants. Expression of scl (blue) and myoD (red) in control (A), and pax2a/pax8 double morphant (B) demonstrates that loss of Pax gene expression does not cause scl upregulation. Arrowheads indicate the area of strongest upregulation of scl seen in osr1 morphants. Expression of pax2a in control (C), scl morphant (D) similarly shows no large expansion of pax2a expression. Expression of pax2a in osr1 morphant (E) and osr1/scl double morphant (F) shows no rescue of pax2a expression. Arrowheads in C-F indicate the proximal nephron segment lost in osr1 morphants. The data indicate that Pax genes and scl are not involved in a mutual repression mechanism.