
Fig. 6
- ID
- ZDB-IMAGE-080919-15
- Publication
- Fürthauer et al., 1999 - Three different noggin genes antagonize the activity of bone morphogenetic proteins in the zebrafish embryo
- All Figures
- Figures for Fürthauer et al., 1999
|
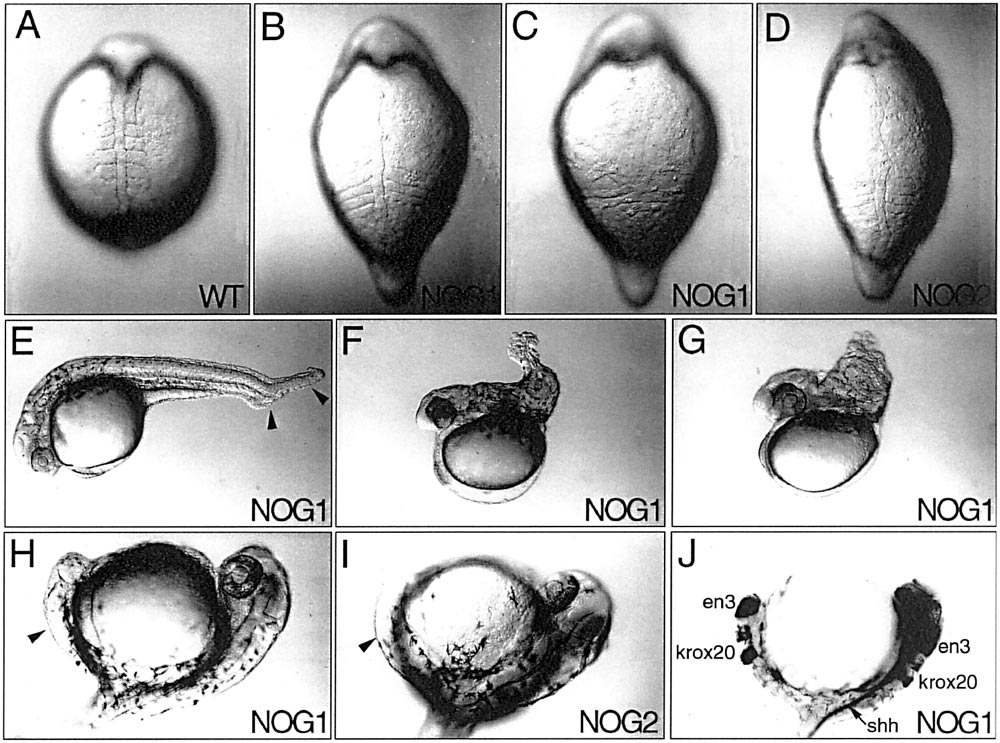
Fig. 6 Overexpression of zebrafish noggin genes dorsalizes the embryo and induces the formation of a partial secondary axis. (A–D) 5-somite-stage embryos. (A, B, D) Dorsal view. (C) Ventral view. Compared to uninjected control embryos (A), embryos injected with 20 pg mRNA encoding nog1 (B) or nog2 (D) are ovoid and display enlarged somites. (C) In severely affected embryos the somites are fused on the ventral side. (E–G) Lateral view of 36-h-old embryos injected with 4 (E) or 10 pg (F, G) nog1 mRNA. Injection of increasing amounts of noggin leads to posterior truncations of increasing severity. (H–J) Localized misexpression of nog1 or nog2 in one blastomere at the 16-cell stage induces the formation of a partial secondary axis (arrowhead). (J) The secondary axis comprises rhombomeres 3 and 5 stained by krox20 and the midbrain–hindbrain boundary visualized by en3 expression but lacks a sonic hedgehog-expressing floor plate, which is present only in the primary axis (arrow).
Reprinted from Developmental Biology, 214(1), Fürthauer, M., Thisse, B., and Thisse, C., Three different noggin genes antagonize the activity of bone morphogenetic proteins in the zebrafish embryo, 181-196, Copyright (1999) with permission from Elsevier. Full text @ Dev. Biol.