
IMAGE
Fig. S21
- ID
- ZDB-IMAGE-080912-11
- Publication
- Kapsimali et al., 2007 - MicroRNAs show a wide diversity of expression profiles in the developing and mature central nervous system
- All Figures
- Figures for Kapsimali et al., 2007
Image
|
Figure Caption
Fig. S21
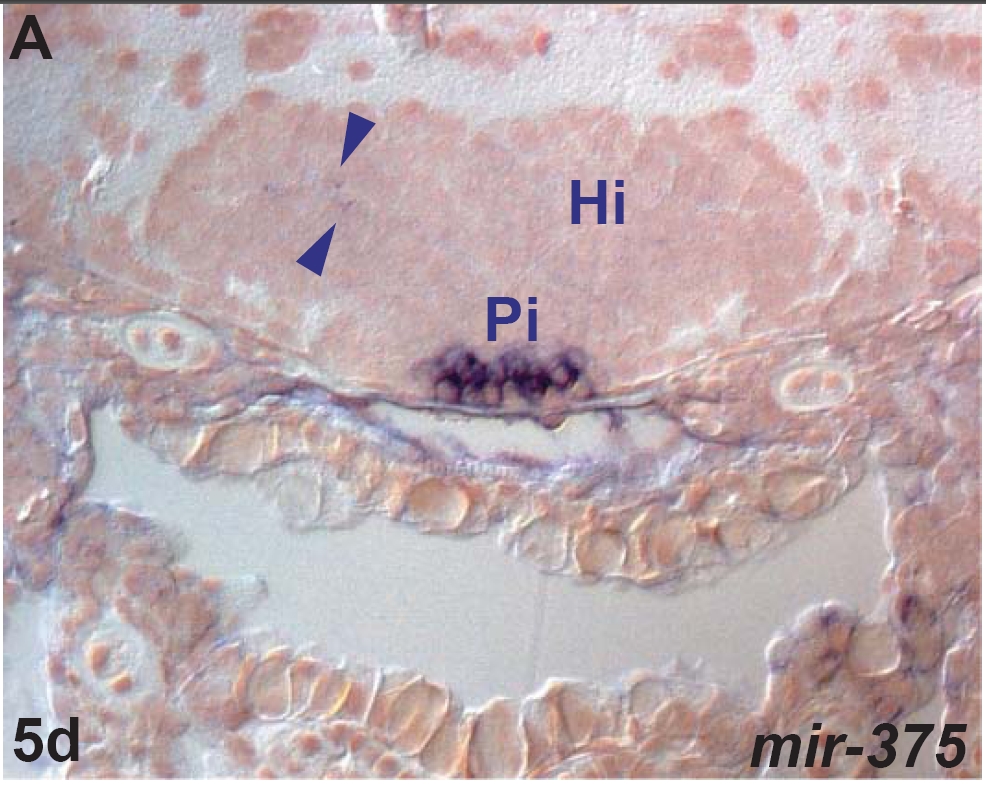
miR-375 expression in the zebrafish brain.
miR-375 shows cell type specific expression the pituitary, a few hypothalamic cells and cranial nerve ganglia (Table E).
A. transverse section through the embryonic intermediate hypothalamus (Hi) showing weak miR-375 expression in the hypothalamus (arrowheads) and strong expression in the pituitary (Pi).
Acknowledgments
This image is the copyrighted work of the attributed author or publisher, and
ZFIN has permission only to display this image to its users.
Additional permissions should be obtained from the applicable author or publisher of the image.
Open Access.
Full text @ Genome Biol.