
IMAGE
Fig. S4
- ID
- ZDB-IMAGE-080904-55
- Publication
- Kai et al., 2008 - Sphingosine-1-phosphate receptors regulate individual cell behaviours underlying the directed migration of prechordal plate progenitor cells during zebrafish gastrulation
- All Figures
- Figures for Kai et al., 2008
Image
|
Figure Caption
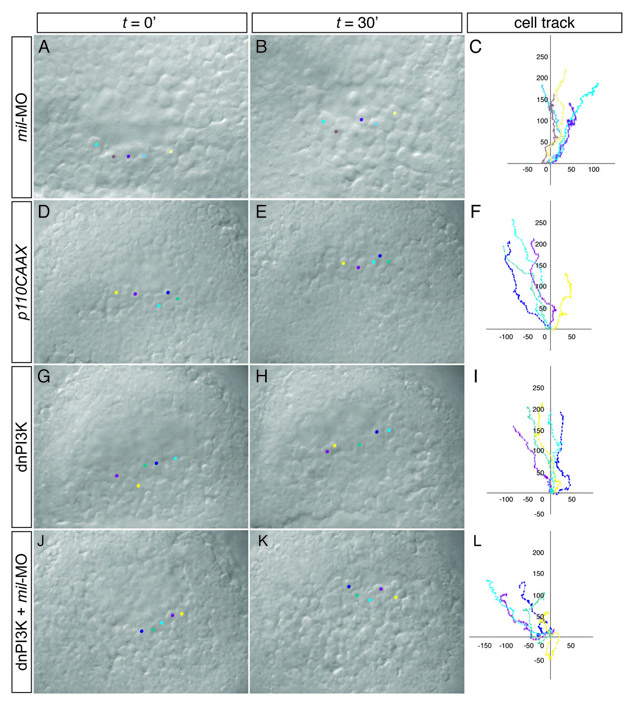
Fig. S4 Time-lapse analysis and tracking of cell movement in migrating prechordal plate progenitors. (A-L) WT embryos injected with 4.3 ng mil-MO (A-C), 125 pg p100CAAX (ca-PI3K) RNA (D-F), 250 pg dn-PI3K RNA (G-I) or 250 pg dn-PI3K RNA together with 4.3 ng mil-MO (J-L).
Figure Data
Acknowledgments
This image is the copyrighted work of the attributed author or publisher, and
ZFIN has permission only to display this image to its users.
Additional permissions should be obtained from the applicable author or publisher of the image.
Full text @ Development