
|
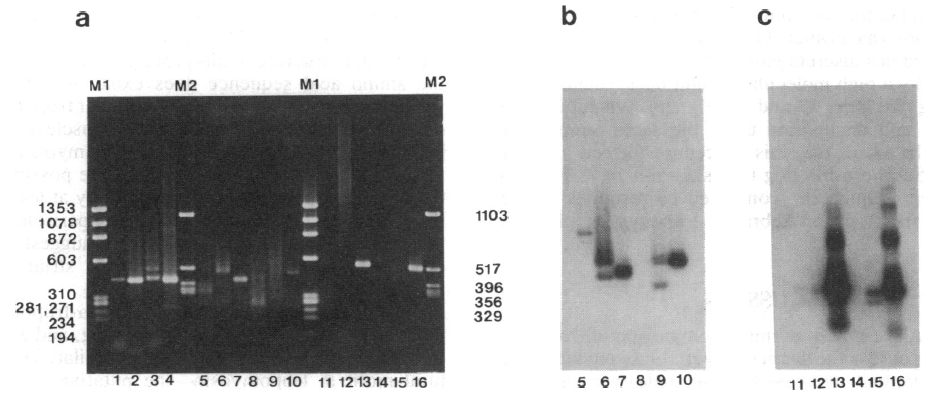
Fig. 2 (a) Agarose gels stained with ethidium bromide showing the results of amplifications of core, 3′, and 5′ regions. Lanes Ml and M2, DNA size markers (given in nucleotides) (ΦX Hae III digest and Bluescript Hinfl digest). Lanes 1-4, results of core region amplification: frog cDNA, primers R1/R2 (lane 1); primers R3/R4 (lane 2); fish cDNA, primers R1/R2 (lane 3); primers R3/R4 (lane 4). Lanes 5-10, 3′ end amplifications: frog cDNA, primers (dT)20/R3 (lane 5); primers (dT)20/Fr1 (lane 6); size-selected frog amplification, primers (dT)20/Fr1 (lane 7); fish cDNA, primers (dT)20/R3 (lane 8); primers (dT)20/Fr1 (lane 9); size-selected fish amplification, primers (dT)20/Fr1 (lane 10). Lanes 11-16, 5′ end amplifications: frog cDNA, primers (dT)20/R2 (lane 11); primers (dT)20/Fr2 (lane 12); size-selected frog amplification, primers (dT)20/Fr2 (lane 13); fish cDNA, primers (dT)20/R2 (lane 14); primers (dT)20/Fr2 (lane 15); size-selected fish amplification, primers (dT)20/Fr2 (lane 16). (b) Southern blot of lanes 5-10, probed with oligomer Fr4. (c) Southern blot of lanes 11-16, probed with oligomer Fr3.