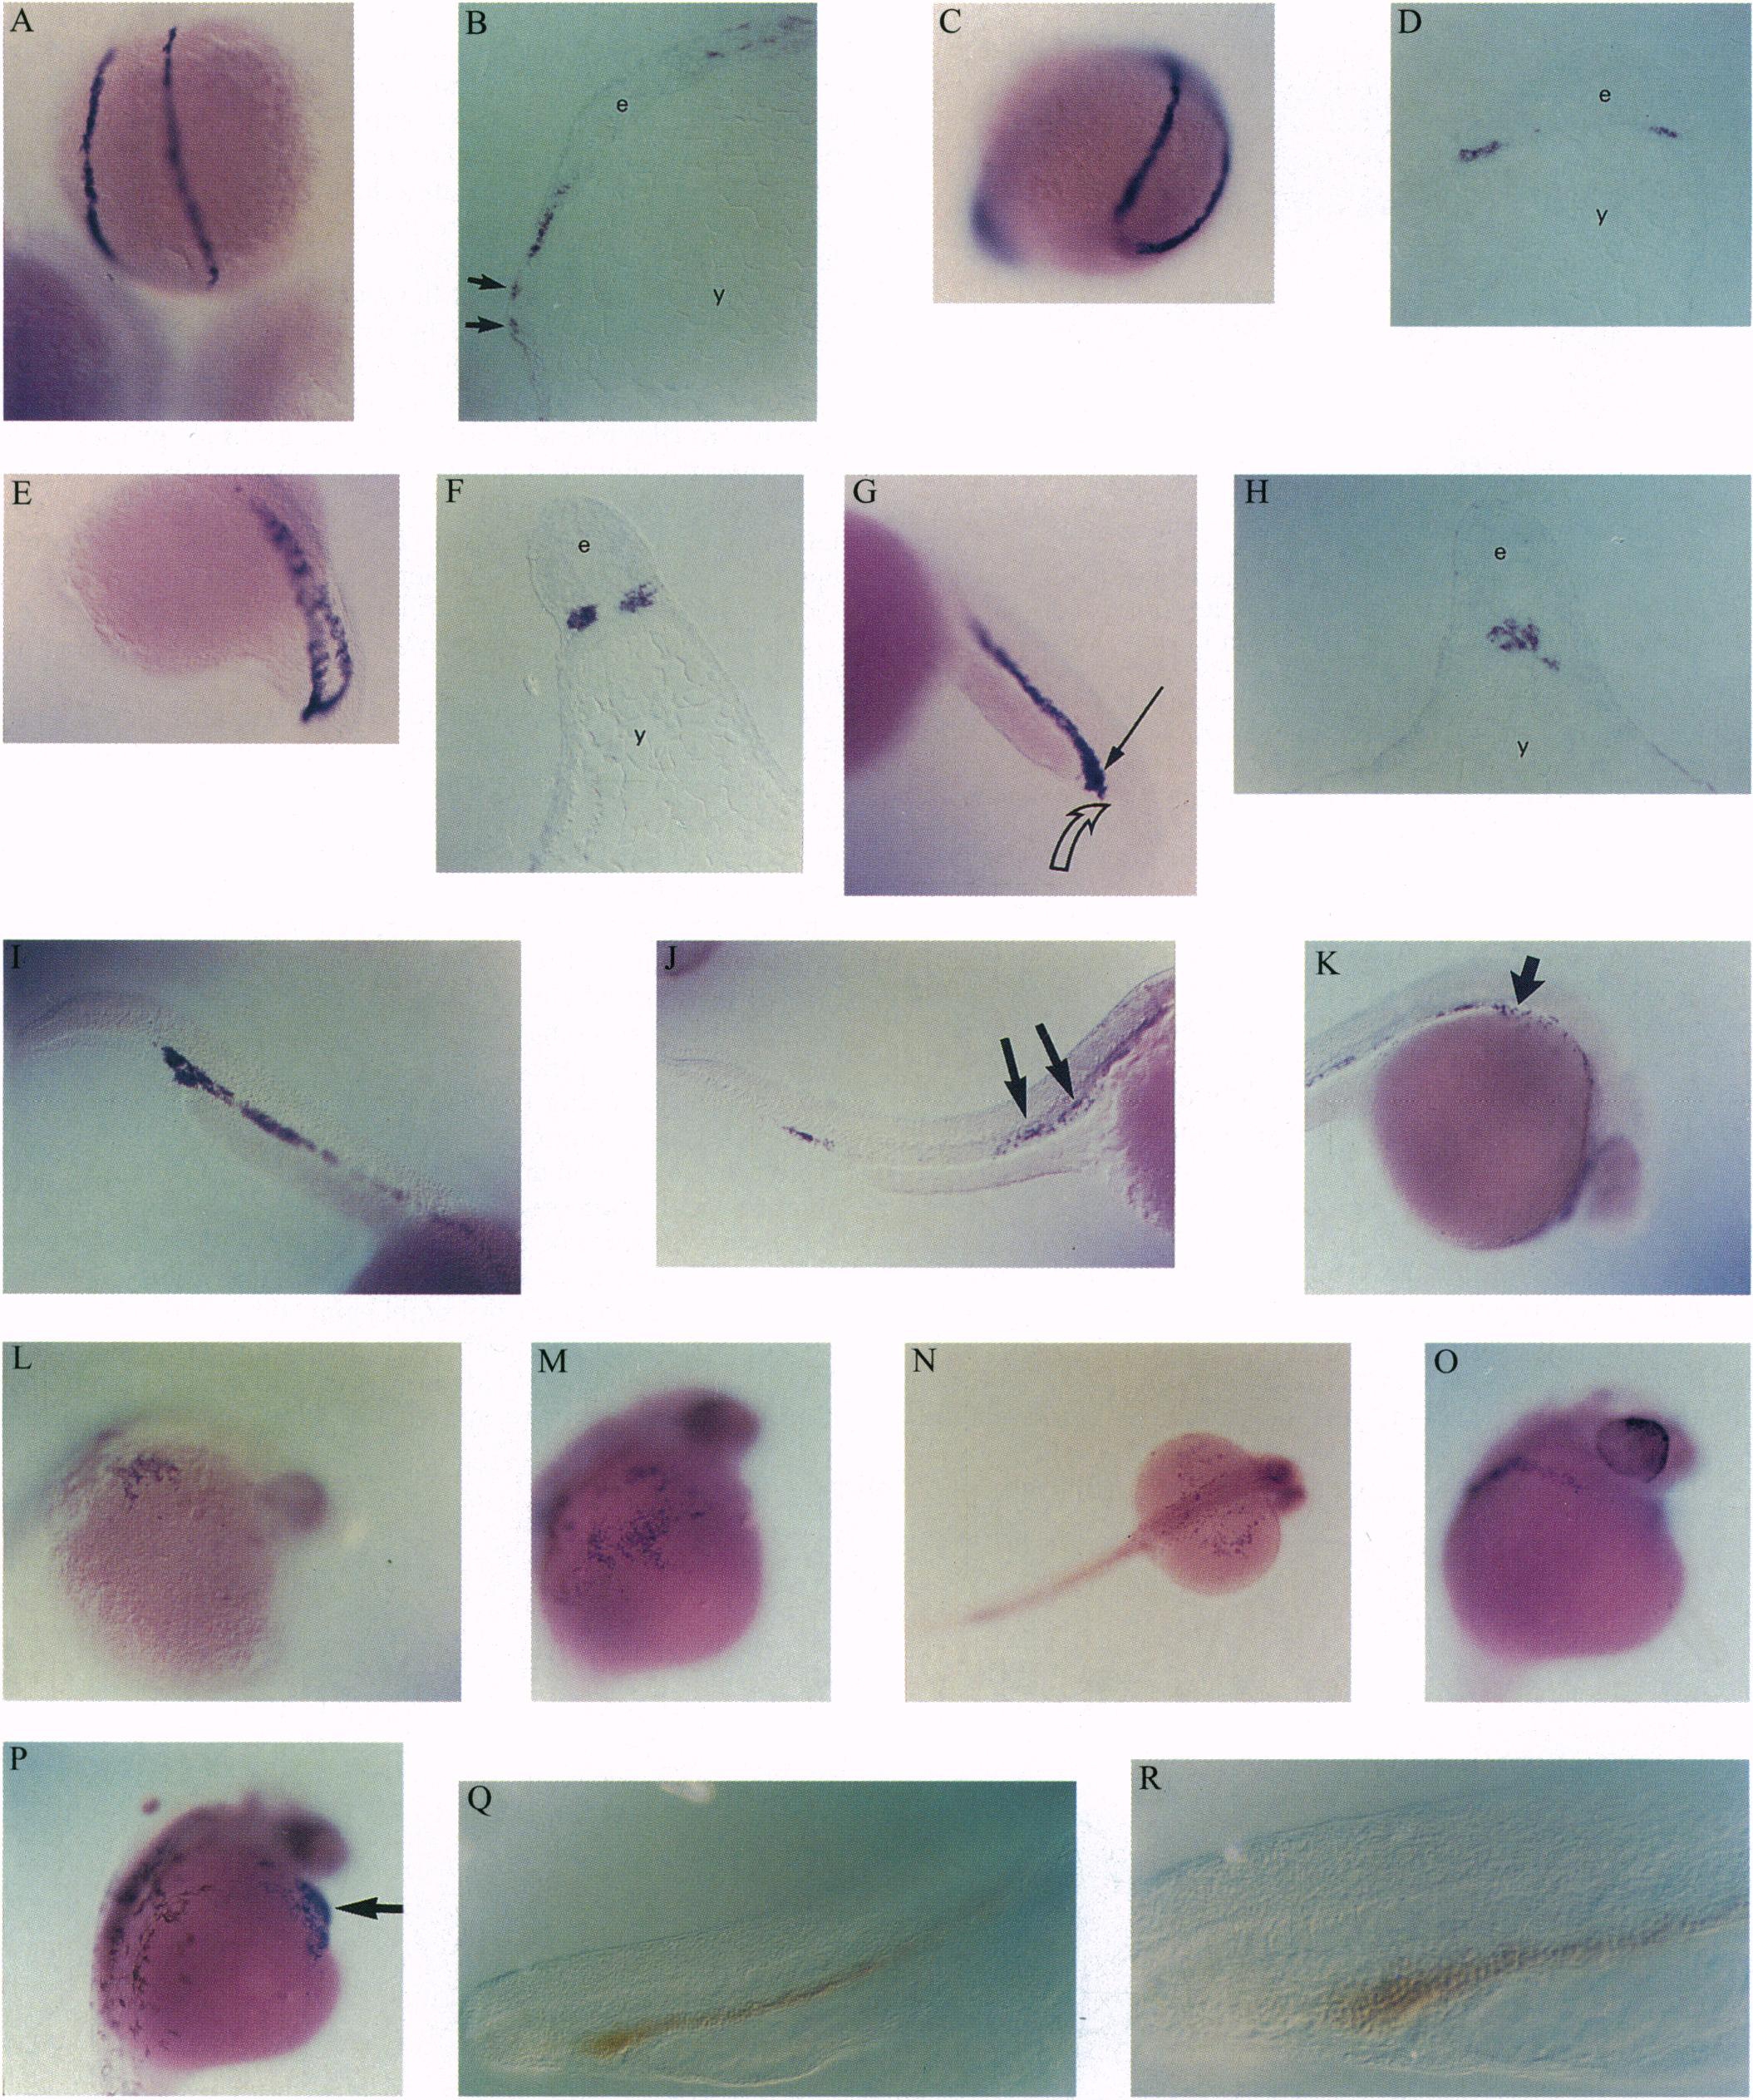
Fig. 2 Expression of GATA-1 and globin during zebrafish embryogenesis. In situ hybridization was performed with fixed zebrafish embryos at the following stages: (A and B) Two somites. (C and D) Five somites. (E and F) Eighteen somites. (G and H) Twenty-three hours (before prim 5 stage). (I) Twenty-four hours (prim 5). (J) Twenty-five hours. (K) Twenty-six hours. (L-P) Twenty-six to 29 h. (B, D, F, and H) Cross-sections through the posterior region or tail bud (IM) of embryos corresponding to (A, C, E, and G). For each section, e denotes the embryo and y indicates the yolk. The arrows in B show GATA-1-expressing progenitors that reside in contact with the yolk syncytial layer. The closed arrow in G indicates the posterior boundary of GATA-1 expression in the IM. The open arrow in G points to undifferentiated, GATA-2-expressing progenitors in the posterior IM (see Fig. 3E). The arrows in J and K show hematopoietic progenitors migrating anteriorly and onto the yolk sac. Erythroid cells later enter the heart (P, arrow). [M, 0, and P are normal sibs from a cross of two spadetail (31) heterozygotes.] (Q and R) o-Dianisidine staining of 24-h wild-type zebrafish embryos. The brown color indicates erythroid cells containing hemoglobin in the IM region.
Image
Figure Caption
Acknowledgments
This image is the copyrighted work of the attributed author or publisher, and
ZFIN has permission only to display this image to its users.
Additional permissions should be obtained from the applicable author or publisher of the image.
Full text @ Proc. Natl. Acad. Sci. USA

