
|
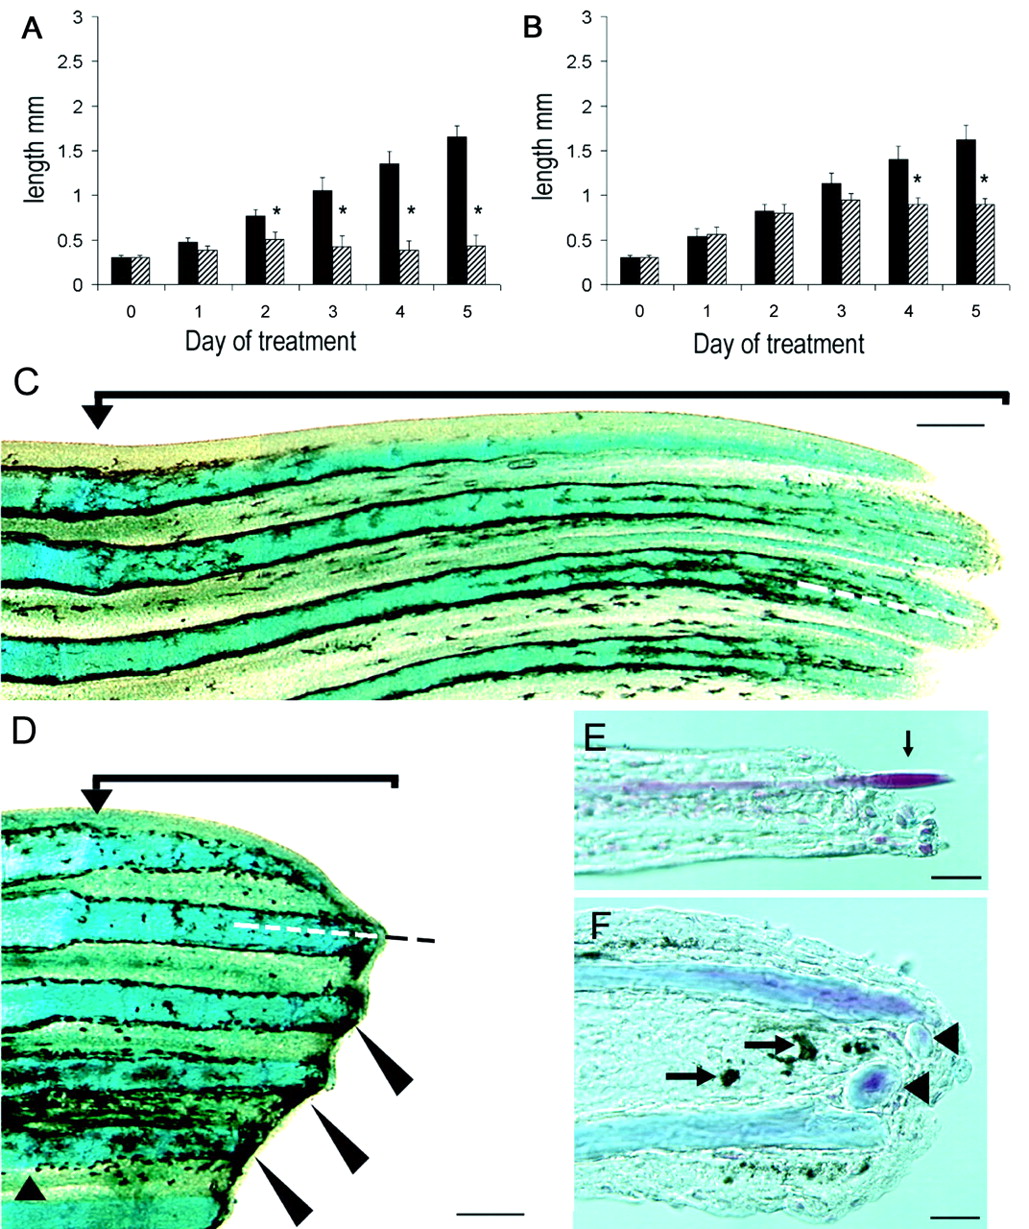
Fig. 3 (A, B) Growth curves of fins treated with 10 μM (A) or 5 μM (B) solanidine (black bars) or cyclopamine (diagonal hatched bars). The ordinate indicates the length of the fins in millimeters and the abscissa the day of treatment, where day 0 is the day fish were first put into alkaloid solution. At 10 μM, fin outgrowth is significantly inhibited by day 2 of treatment (asterisks, P < 0.05) and by day 4 of treatment at 5 μM (asterisks, P < 0.05). P values were derived by using the Student's t test, error bars = SEM. (C-F) Effects of cyclopamine on caudal fin regeneration, proximal part of the fin is to the left; (C, D) whole mount fins stained with Alcian blue. Exposure to 5 μM cyclopamine (D) for 5 days results in the inhibition of fin outgrowth compared with 5 μM solanidine (C). Melanocytes accumulate in the distal stumps of the rays (large arrowheads) and the blastema is clearly absent. Small arrowhead in D indicates the level of fin amputation (low cut). The dotted line indicates the plane of sections shown in E and F. Cryosections (16 μm) along the longitudinal axis of fins treated with 10 μM cyclopamine (F) or solanidine (E) and stained with Alcian blue and Sirius red. Note pigment accumulation and extra bone deposition in the distal-most portion of the section (arrows) and the lack of actinotrichia as shown in E (arrow). [Bar (C, D) = 100 μm; (E, F) = 25 μm.]