
Image
|
Figure Caption
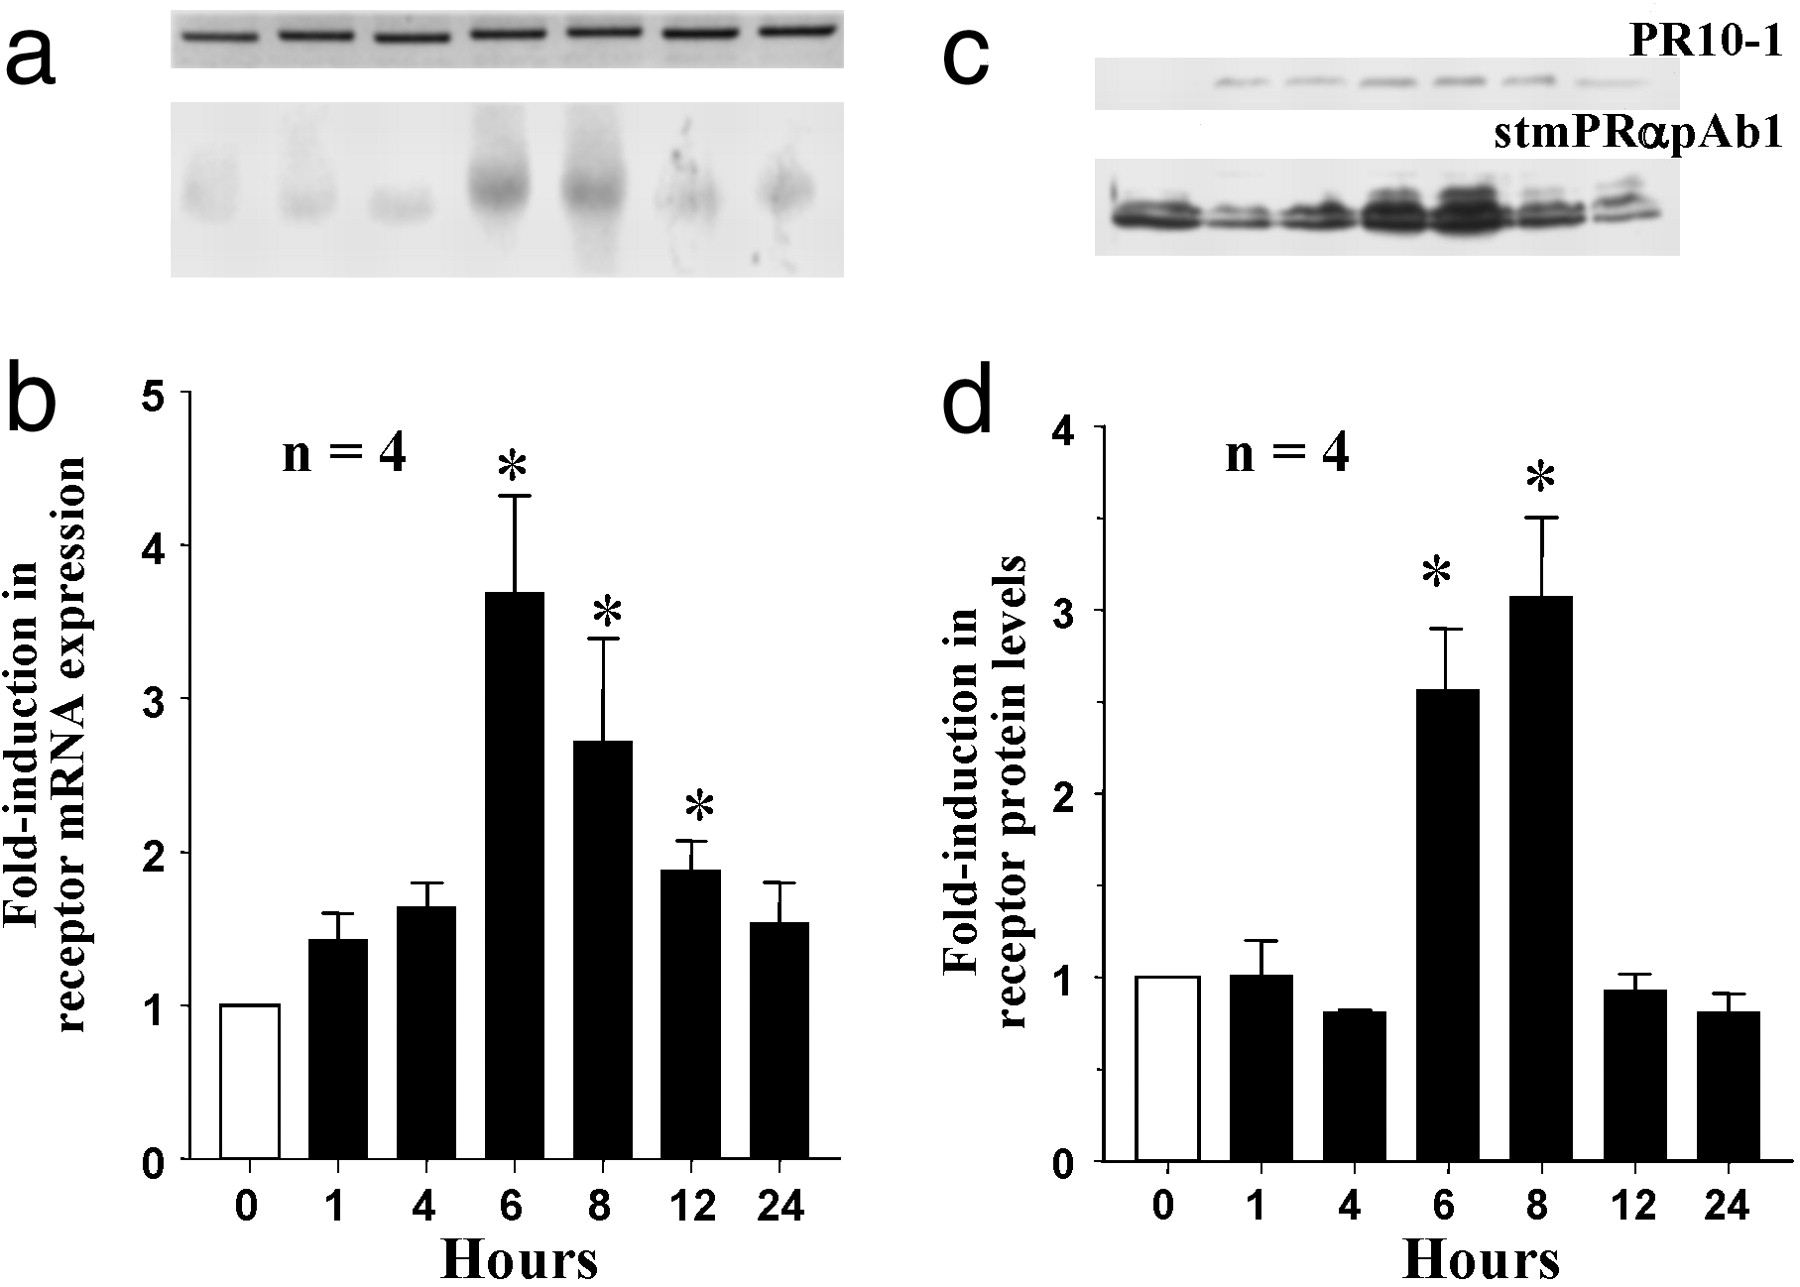
Fig. 5 Time course of changes in putative mPR mRNA (a and b) and protein levels (c and d) in ovarian fragments after in vitro treatment with 300 nM 207beta;-S, relative to control (0 h) values (mean ± SEM, n = 4; *, P < 0.05). (a) Representative Northern blot (gel loading: 1 μg). (Lower) Putative mPR mRNA. (Upper) Corresponding β-actin mRNA. (b) Relative levels of mPR mRNA. (c) Representative Western blot analyses using PR10-1 and stmPRαAb1 antibodies (gel loading: 10 μg). (d) Relative levels of mPR protein.
Acknowledgments
This image is the copyrighted work of the attributed author or publisher, and
ZFIN has permission only to display this image to its users.
Additional permissions should be obtained from the applicable author or publisher of the image.
Full text @ Proc. Natl. Acad. Sci. USA