
Fig. 7
- ID
- ZDB-IMAGE-080513-25
- Publication
- Hjorth et al., 2001 - Are pioneer axons guided by regulatory gene expression domains in the zebrafish forebrain? High-resolution analysis of the patterning of the zebrafish brain during axon tract formation
- All Figures
- Figures for Hjorth et al., 2001
|
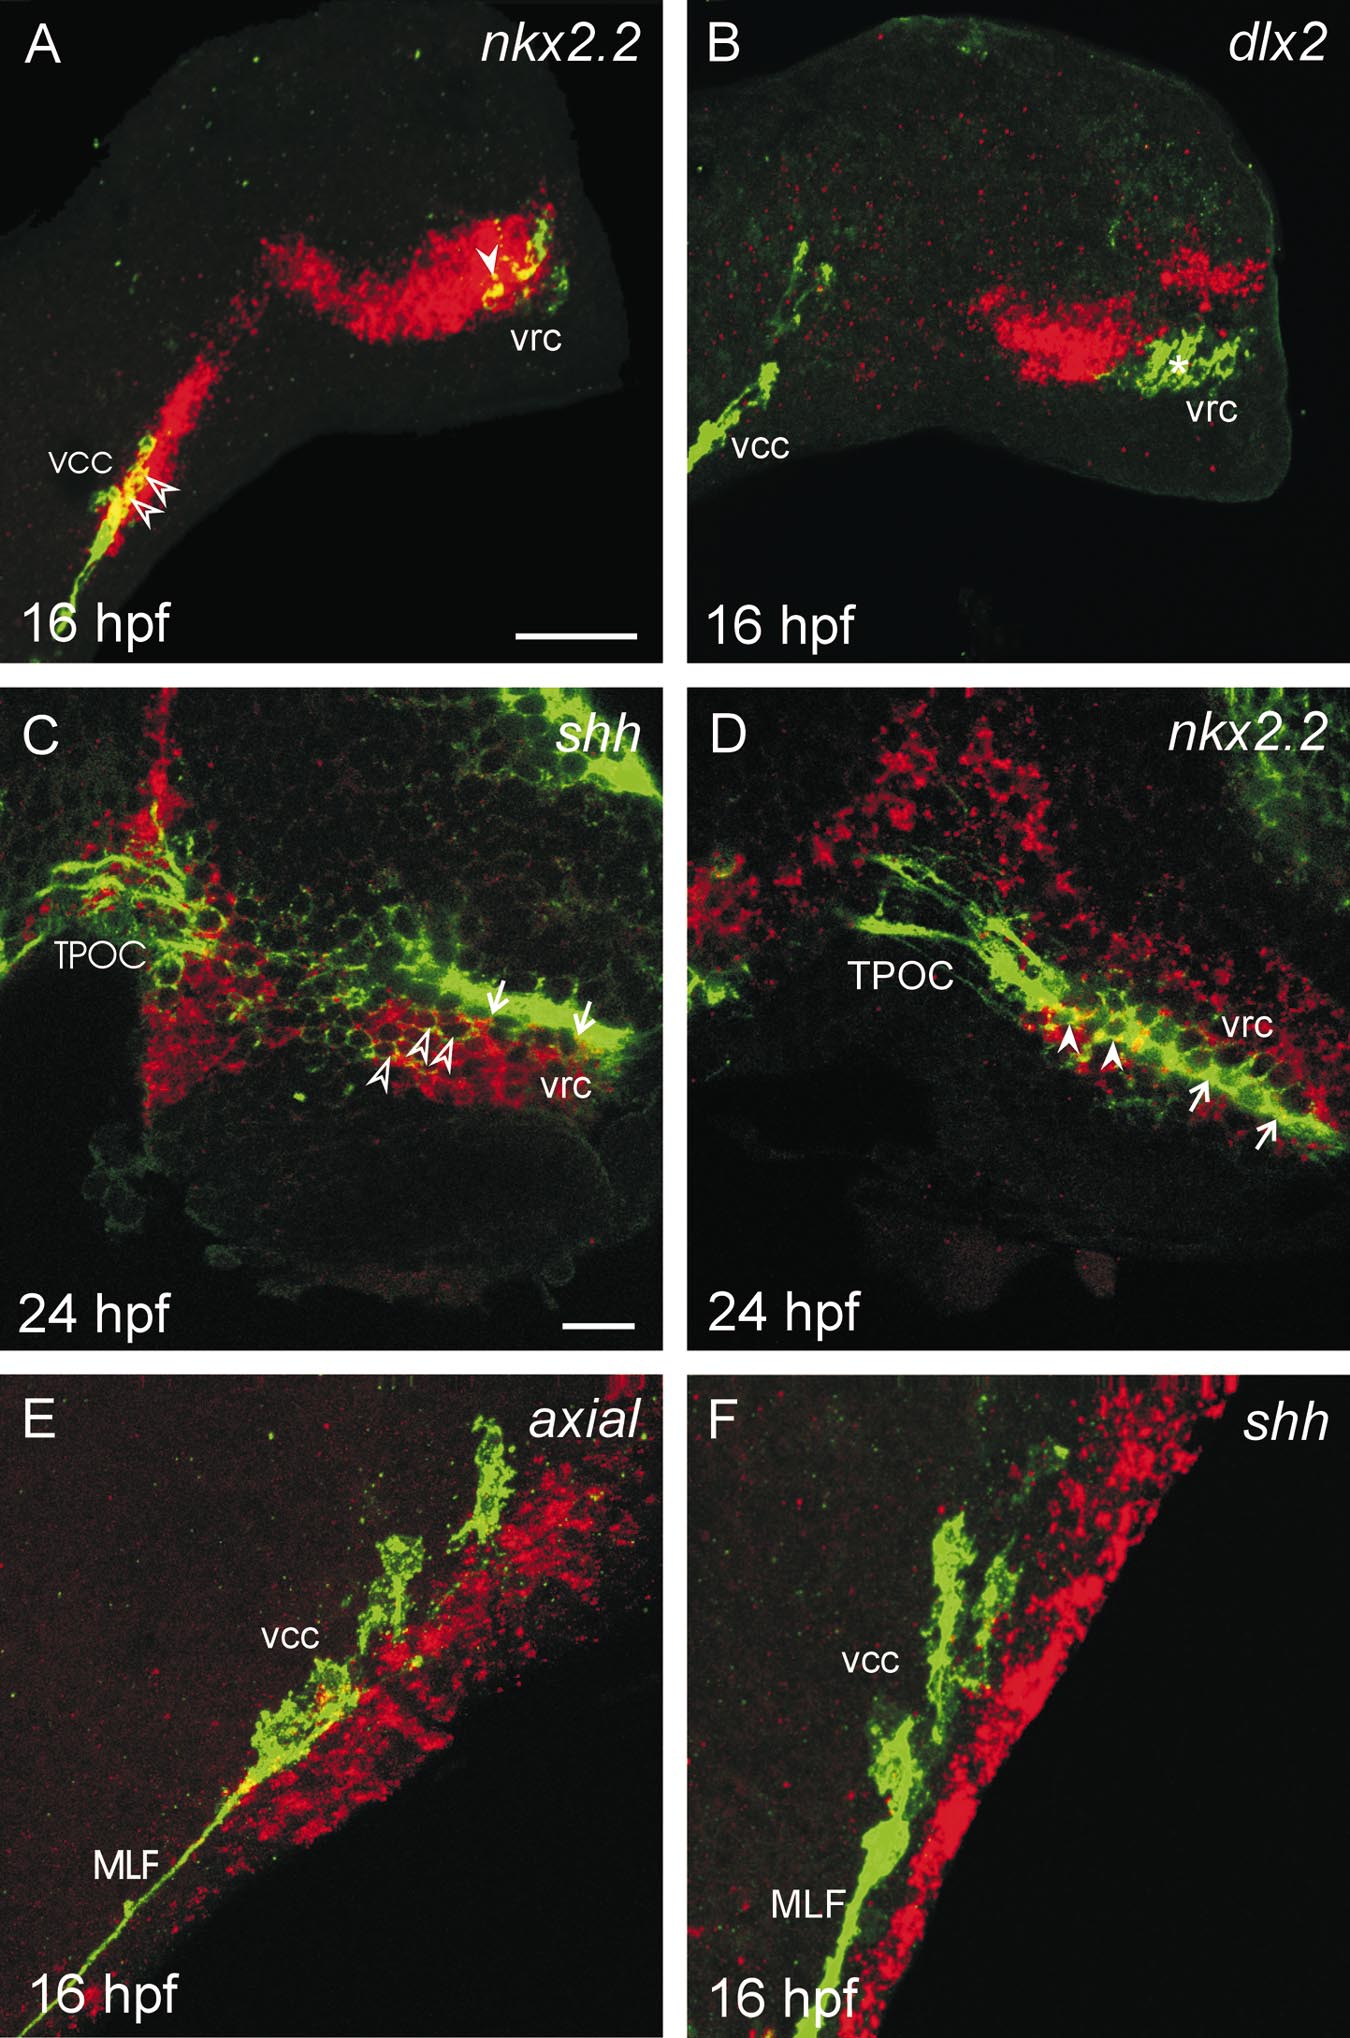
Fig. 7 The first neuronal clusters of the zebrafish brain exhibit heterogeneous gene expression patterns. Confocal laser scanning microscope Z-series images (A, B, E, and F) of lateral views of whole-mount zebrafish brains (16 and 24 hpf) double labelled for the expression of the HNK-1 epitope (green) and (A, D) nkx2.2, (B) dlx2, (C, F) shh, and (E) axial in red. (C and D) Single-level scans taken from a Z series. Rostral is to the right and dorsal is to the top. MLF, medial longitudinal fasciculus; TPOC, tract of the postoptic commissure; vcc, ventrocaudal cluster; vrc, ventrorostral cluster. Bar: 50 μm in A, B; 20 μm in C, D, E, F.
Reprinted from Developmental Biology, 229(2), Hjorth, J.T. and Key, B., Are pioneer axons guided by regulatory gene expression domains in the zebrafish forebrain? High-resolution analysis of the patterning of the zebrafish brain during axon tract formation, 271-286, Copyright (2001) with permission from Elsevier. Full text @ Dev. Biol.