
Fig. 5
- ID
- ZDB-IMAGE-080513-23
- Publication
- Hjorth et al., 2001 - Are pioneer axons guided by regulatory gene expression domains in the zebrafish forebrain? High-resolution analysis of the patterning of the zebrafish brain during axon tract formation
- All Figures
- Figures for Hjorth et al., 2001
|
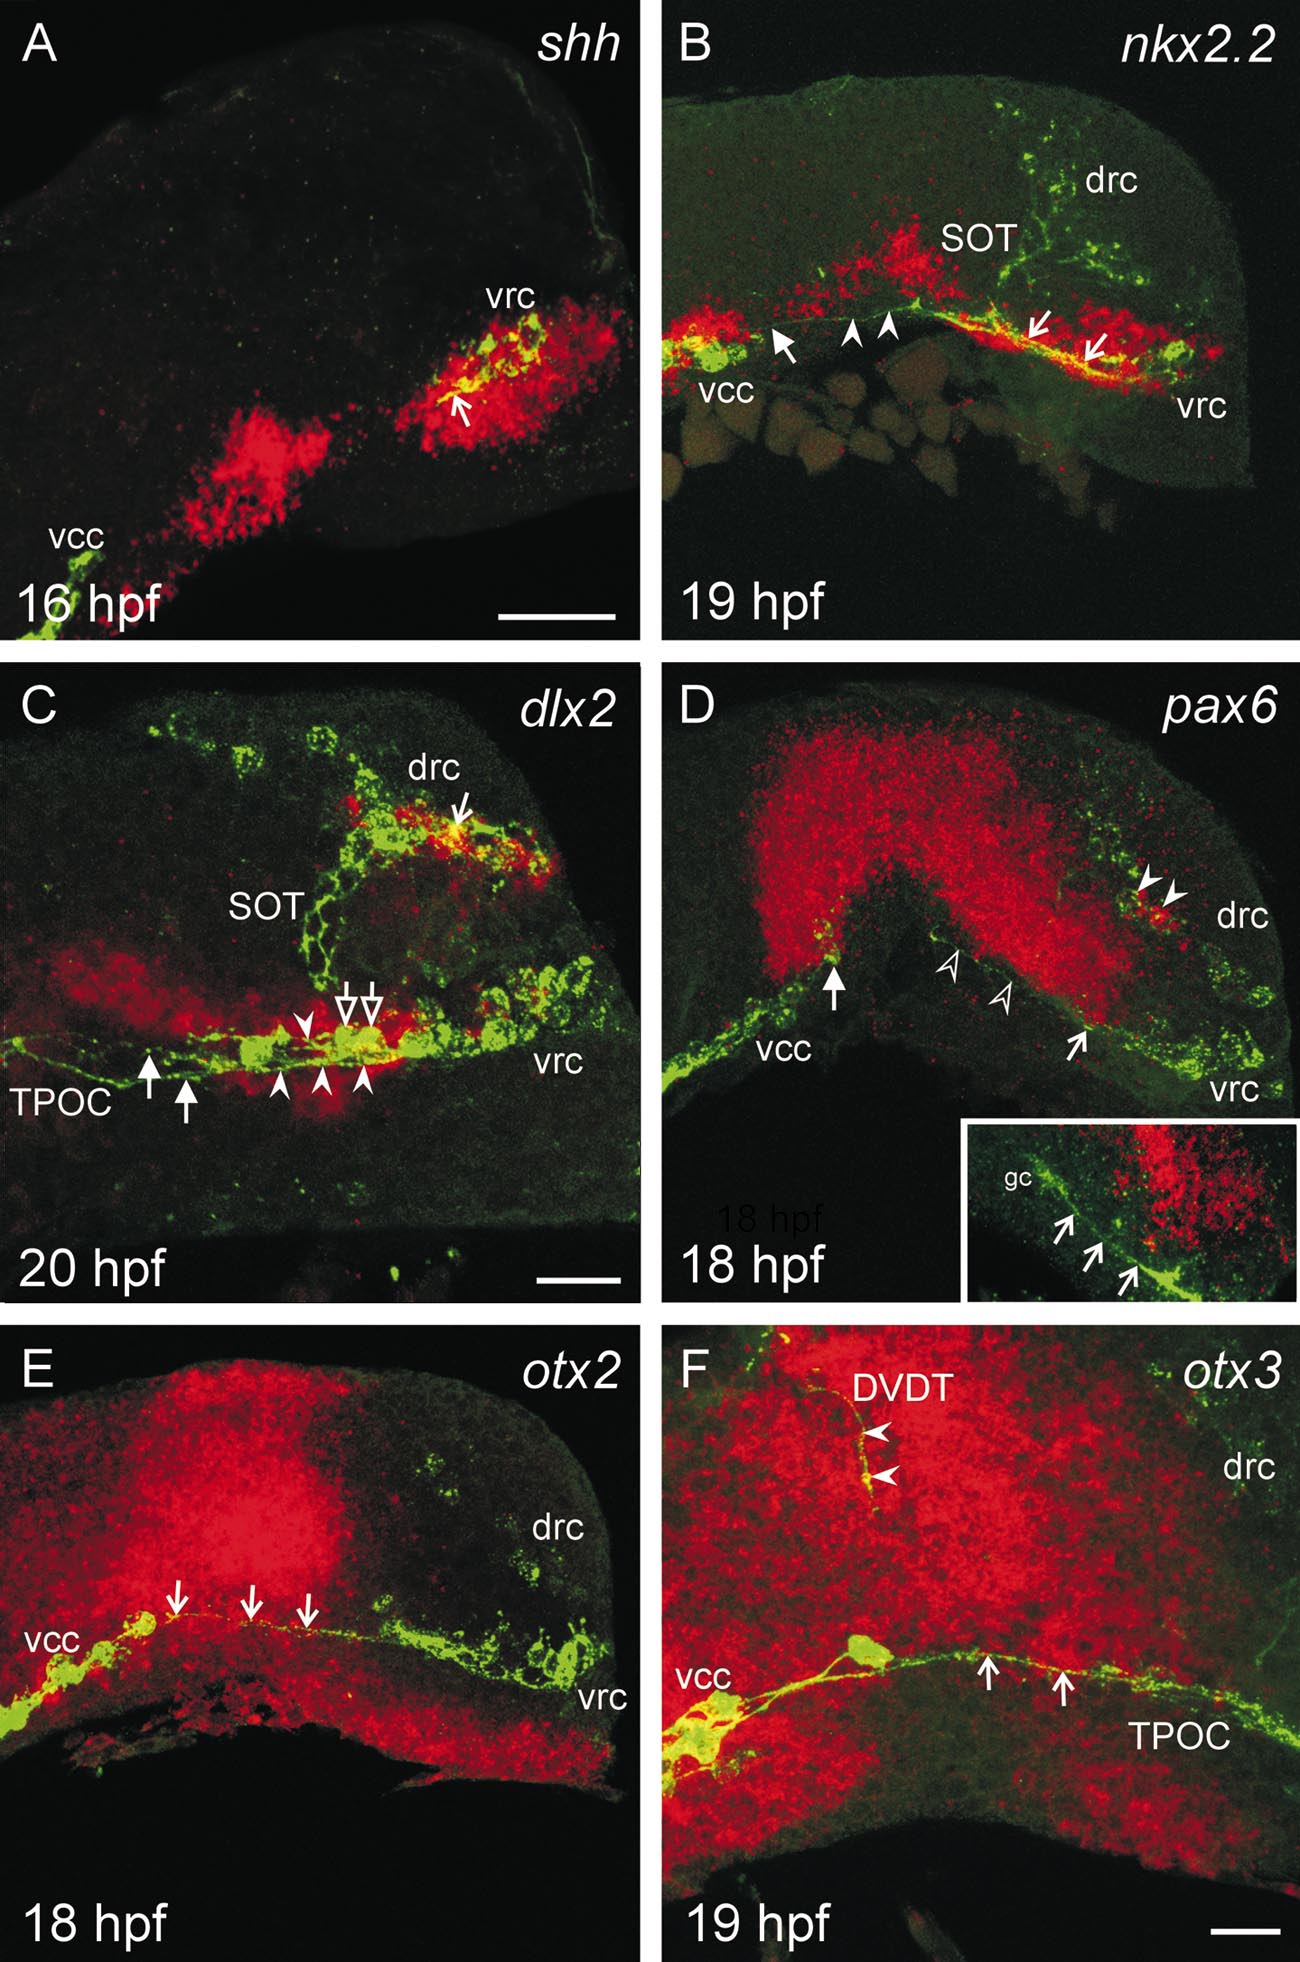
Fig. 5 The first neurons and axons of the zebrafish brain exhibit a dynamic spatial relationship to gene expression domains. Confocal laser scanning microscope Z-series images of lateral views of whole-mount zebrafish brains ages between 16 and 20 hpf double labelled for the expression of the HNK-1 epitope (green) and (A) shh, (B) dlx2, (C) nkx2.2, (D) pax6, (E) otx2, and (F) otx3 in red. Rostral is to the right and dorsal is to the top. drc, dorsorostral cluster; DVDT, dorsoventral diencephalic tract; gc, growth cone; SOT, supraoptic tract; TPOC, tract of the postoptic commissure; vcc, ventrocaudal cluster; vrc, ventrorostral cluster. Bar: 50 μm in A, B, D, E; 30 μm in C; 20 μm in F.
Reprinted from Developmental Biology, 229(2), Hjorth, J.T. and Key, B., Are pioneer axons guided by regulatory gene expression domains in the zebrafish forebrain? High-resolution analysis of the patterning of the zebrafish brain during axon tract formation, 271-286, Copyright (2001) with permission from Elsevier. Full text @ Dev. Biol.