
Fig. 7
- ID
- ZDB-IMAGE-080506-28
- Publication
- Chuang et al., 2001 - Zebrafish genes rx1 and rx2 help define the region of forebrain that gives rise to retina
- All Figures
- Figures for Chuang et al., 2001
|
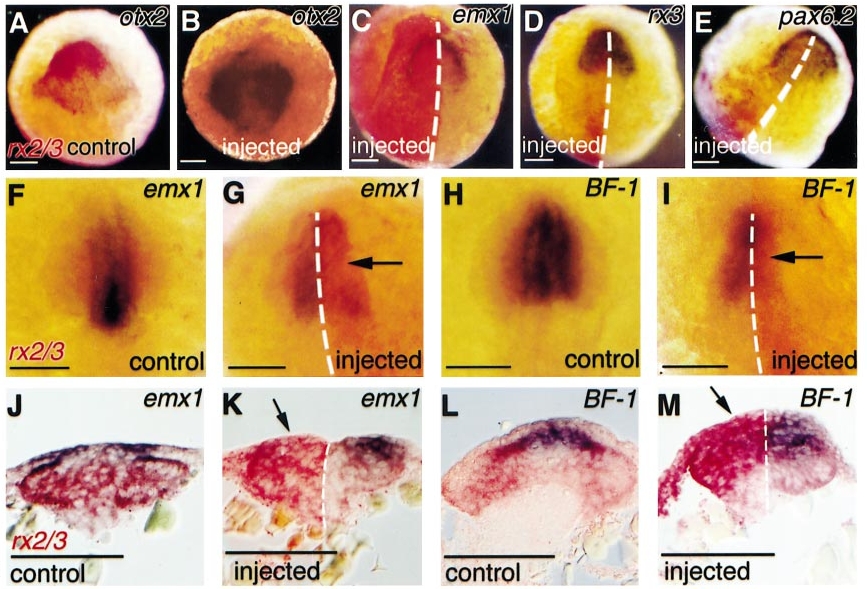
Fig. 7 Gene expression patterns at neural plate and neural keel stages. Red staining represents endogenous rx2 and/or rx3 (A, F, H, J, L) and ectopic rx2 (B-E, G, I, K, M) expression. Purple staining represents the expression of otx2 (A, B); emx1 (C, F, G, J, K); rx3 (D); pax6.2 (E); or BF-1 (H, I, L, M). Note suppression of emx1 (G, K, arrows) or BF-1 (I, M, arrows) by ectopic rx2. Embryos in (B-E, G, I, K, M) were injected with 1 ng rx2ΔC′ RNA. Dorsal view of embryos at 9-10.5 hpf (A-E), or 11-13 hpf (F-M). (J-M) Transverse sections of the whole-mounted embryos are shown in the above panels, respectively. Rostral is up in (A-I). Scale bars: 100 μm.
Reprinted from Developmental Biology, 231, Chuang, J.-C. and Raymond, P.A., Zebrafish genes rx1 and rx2 help define the region of forebrain that gives rise to retina, 13-30, Copyright (2001) with permission from Elsevier. Full text @ Dev. Biol.