
|
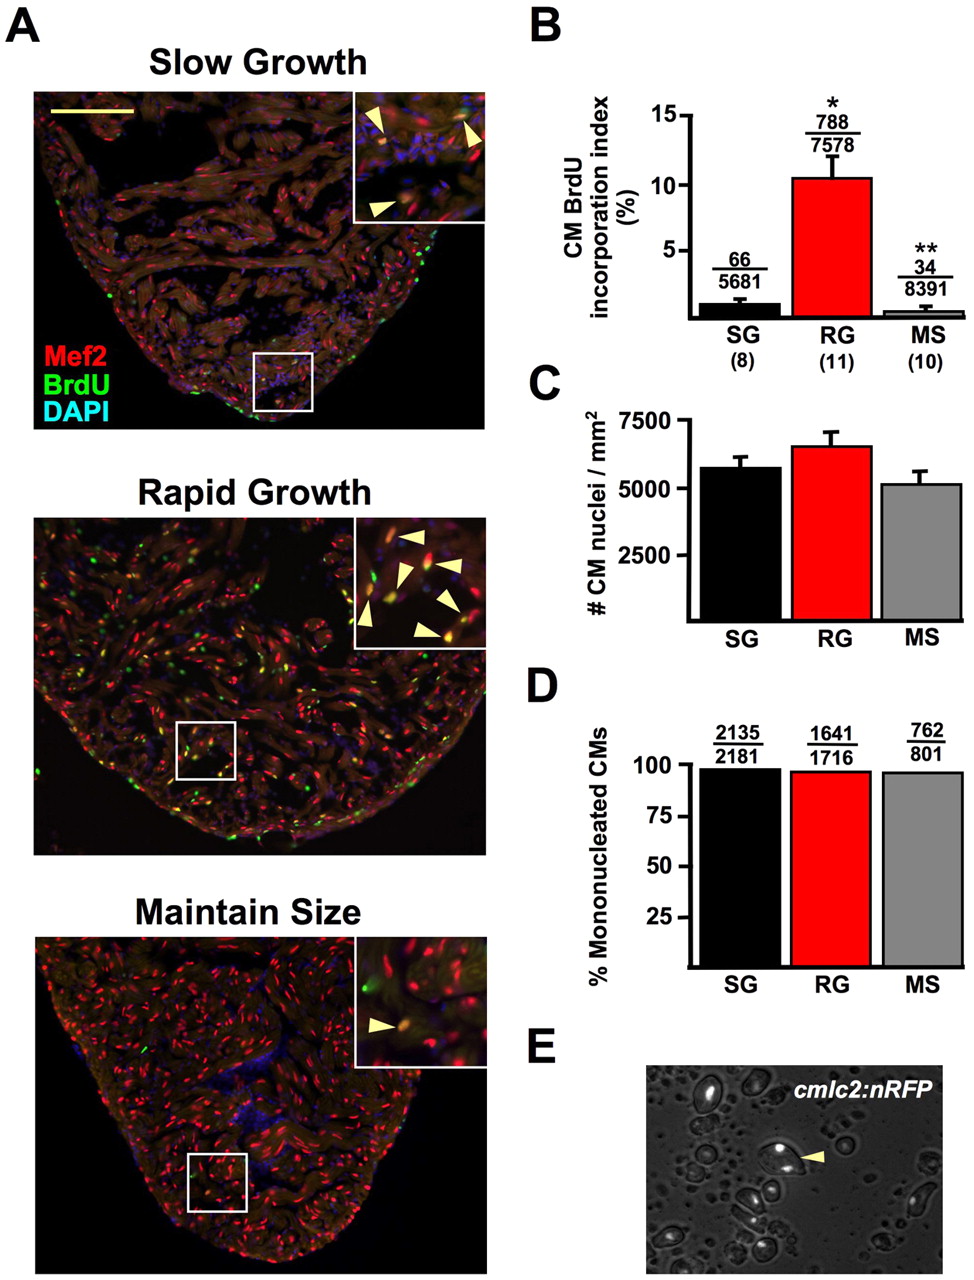
Fig. 2 Cardiac homeostasis involves cardiomyocyte hyperplasia. (A) Ventricles from SG, RG and MS animals stained for Mef2 expression to identify CMs (red), and for BrdU incorporation (green). CM BrdU incorporation was much greater in RG ventricles (arrowheads in insets). Nuclei are labeled with DAPI (blue). (B) Quantification of CM BrdU incorporation in SG, RG and MS groups, plotted as the average BrdU incorporation index per animal (*P<0.001, t-test, significantly different from SG; **P<0.05, t-test, significantly different from SG and RG). Numbers above the error bars indicate BrdU-positive CMs over the total CMs counted from all animals combined. Numbers below group abbreviations indicate the number of animals/ventricles per group. (C) CM hypertrophy was assessed by measuring the number of Mef2-positive nuclei per area of myocardium, as described in Materials and methods. No significant differences in CM density were observed between RG ventricles (6540±505 CMs/mm2) and SG (5842±326 CMs/mm2) or MS ventricles (5167±422 CMs/mm2). Eight animals were used per group. (D) Quantification of nuclei in CMs dissociated from pooled cmlc2:nRFP ventricles from different homeostatic conditions, indicating that 97.9% of CMs are mononucleate in SG ventricles, 95.6% in RG ventricles and 95.1% in MS ventricles. (E) Image of dissociated ventricular CMs (cells with white nuclei) from cmlc2:nRFP animals. Binucleated myocytes (arrowhead) are rare in adult zebrafish under RG, SG, or MS conditions. Thus, CM hypertrophy and binucleation play little or no role in homeostatic cardiac growth. Scale bar in A: 100 μm.