
|
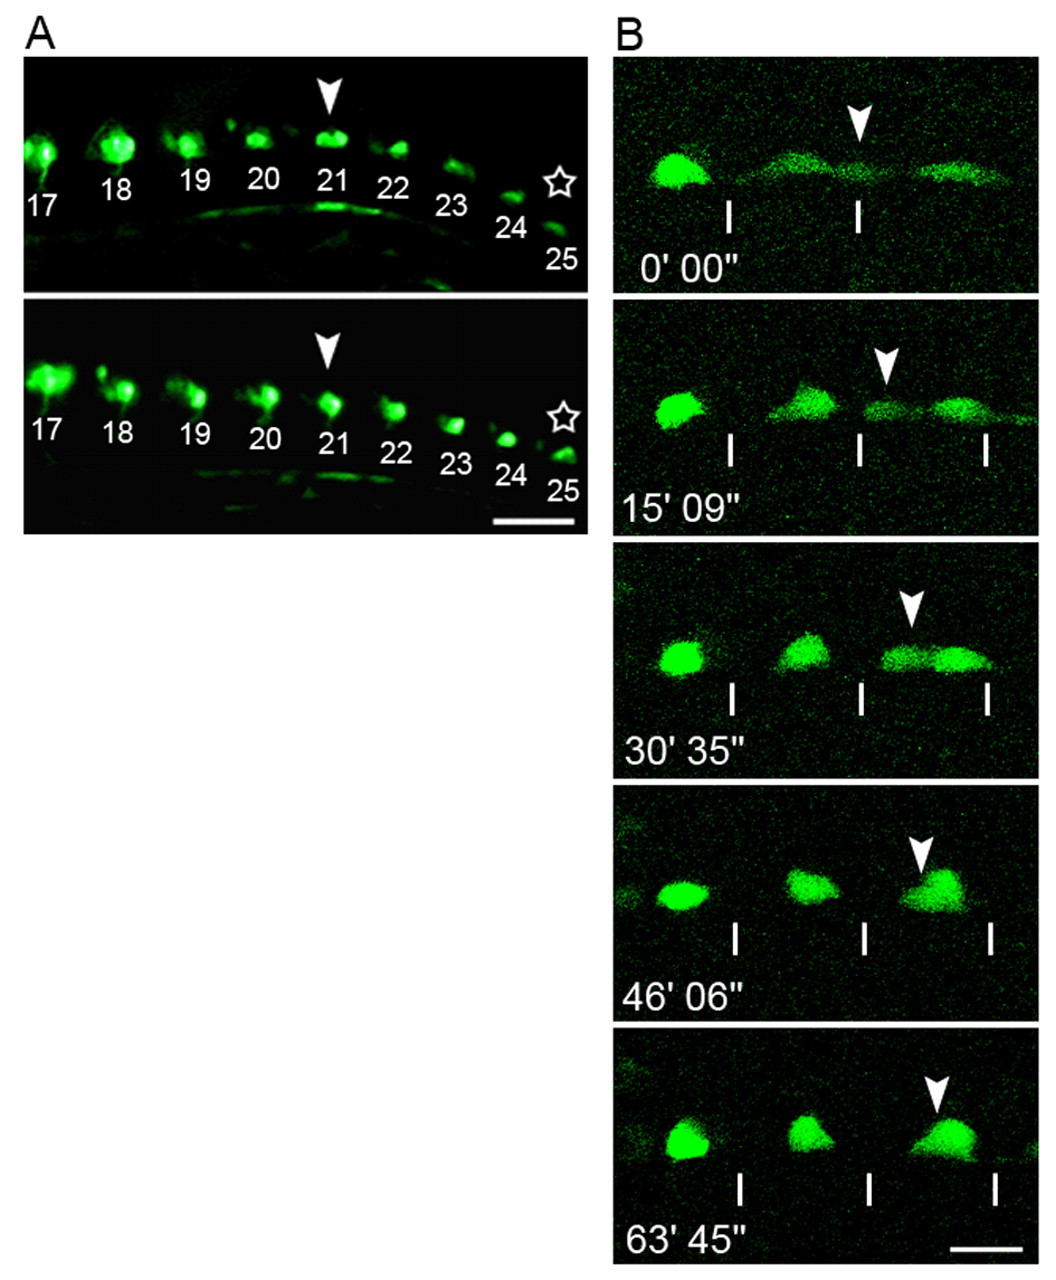
Fig. 2 Live observations of CaP cell bodies in nrp1a:gfp transgenic embryos. (A) Trunk region of the same embryo shown at different stages. Two discrete cells underlying a single somite seen in the upper panel (the 21st somite level at the 27-somite stage: arrowhead) overlapped after 80 minutes, shown in the lower panel. A transition in cell shape between different stages was also observed (stars). The numbers in the panels indicate the segmental order. Scale bar: 50 µm. (B) Confocal micrographs of CaP cell bodies in another embryo. Sequential images were captured of the 16-18th segment, starting from the 17-somite stage (17.5 hpf). A CaP cell body originally located beneath the somite boundary (arrowhead) migrated posteriorly and overlapped with another CaP in the middle of the somite. The numbers denote the time elapsed. The lines indicate segment borders of the somites. Scale bar: 20 μm.