
IMAGE
Fig. 2
- ID
- ZDB-IMAGE-080326-44
- Genes
- Publication
- Hegde et al., 2008 - Genomewide Expression Analysis in Zebrafish mind bomb Alleles with Pancreas Defects of Different Severity Identifies Putative Notch Responsive Genes
- All Figures
- Figures for Hegde et al., 2008
Image
|
Figure Caption
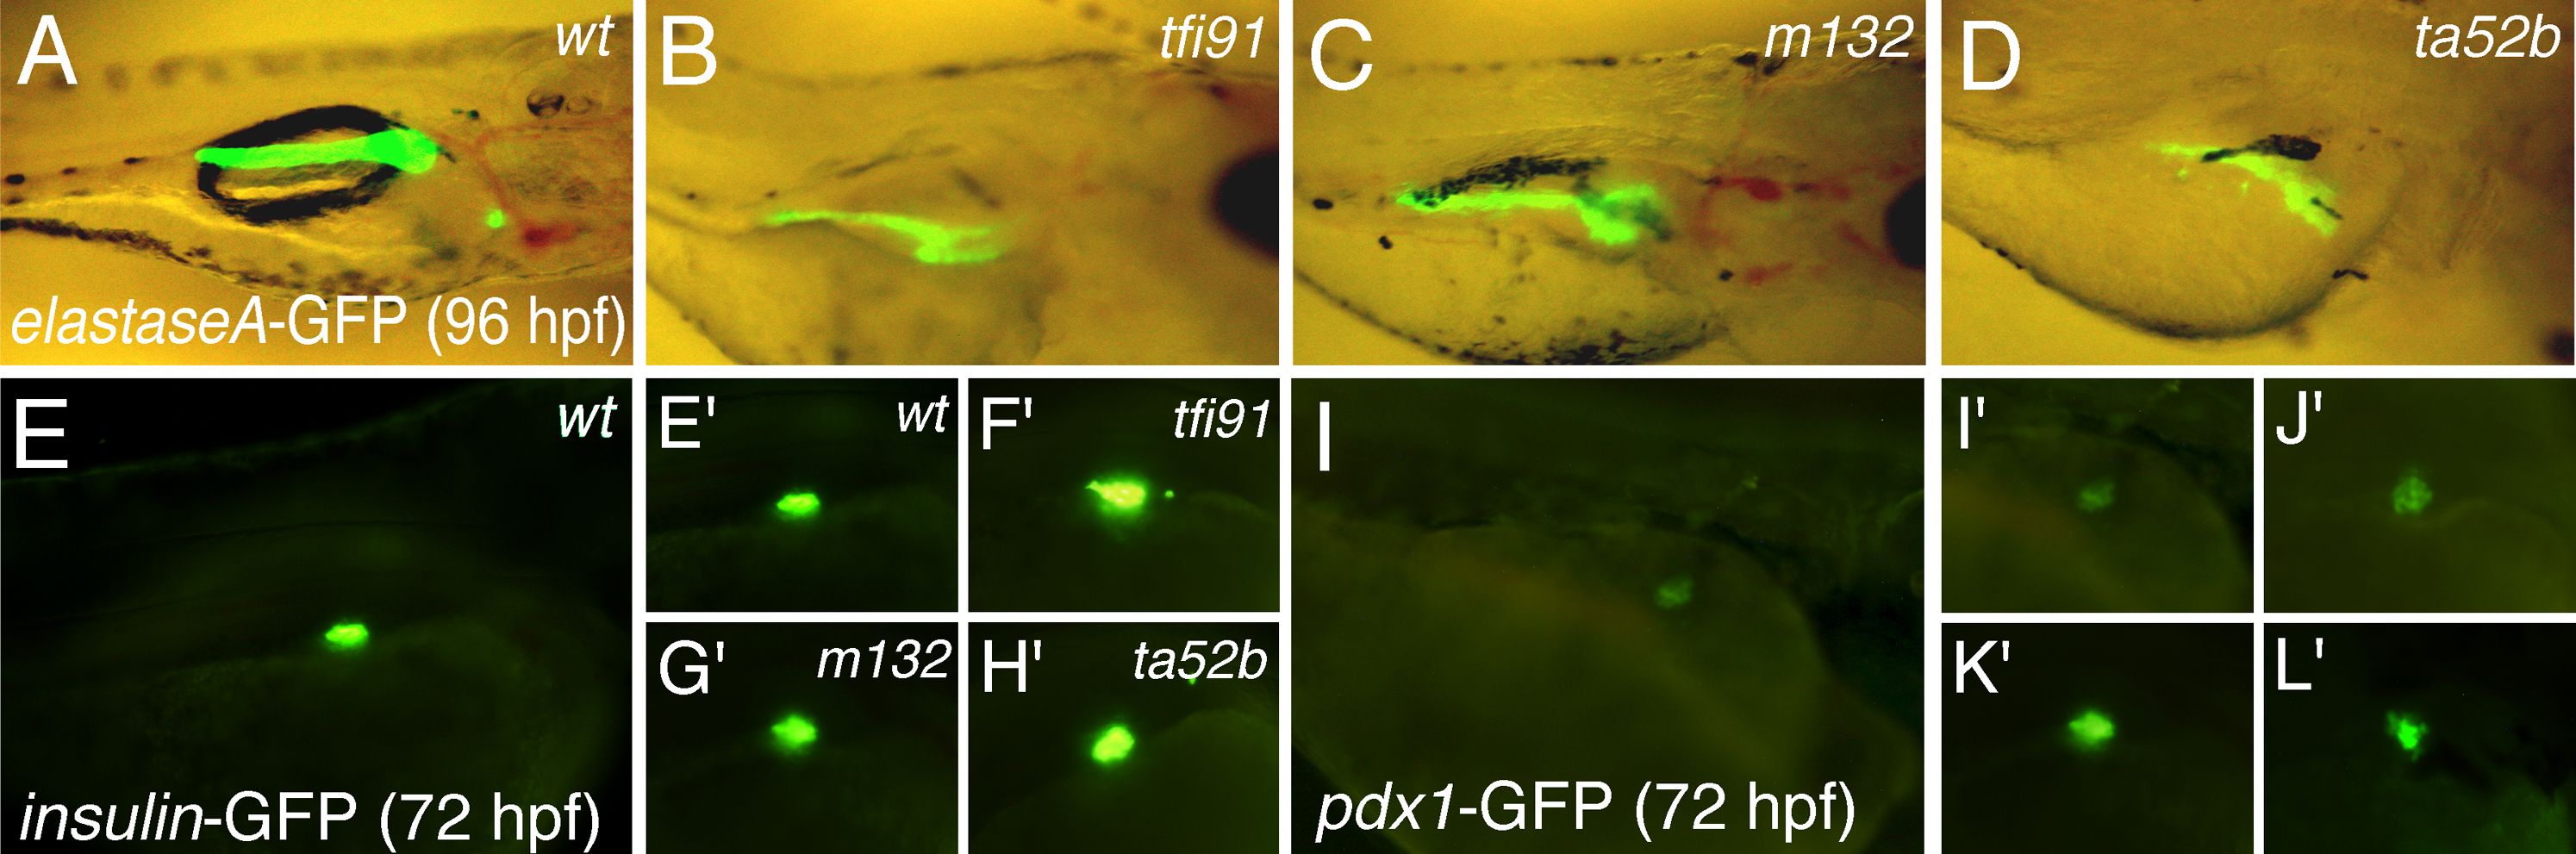
Fig. 2 elastaseA-GFP, insulin-GFP and pdx1-GFP expression in embryos of mib mutant alleles and their wt siblings. Expression of elastaseA-GFP in (A) wt, (B) mibtfi91, (C) mibm132 and (D) mibta52b embryos was analyzed at 96 hpf. Expression of insulin-GFP in (E and E′) wt, (F′) mibtfi91, (G′) mibm132 and (H′) mibta52b embryos was analyzed at 72 hpf. Expression of pdx1-GFP in (I and I′) wt, (J′) mibtfi91, (K′) mibm132 and (L′) mibta52b embryos was analyzed at 72 hpf. Panels A–D are lateral views and the rest are dorsolateral views, oriented anterior to the right.
Figure Data
Acknowledgments
This image is the copyrighted work of the attributed author or publisher, and
ZFIN has permission only to display this image to its users.
Additional permissions should be obtained from the applicable author or publisher of the image.
Full text @ PLoS One