
Fig. 3
- ID
- ZDB-IMAGE-080108-3
- Publication
- Murayama et al., 2006 - Tracing Hematopoietic Precursor Migration to Successive Hematopoietic Organs during Zebrafish Development
- All Figures
- Figures for Murayama et al., 2006
|
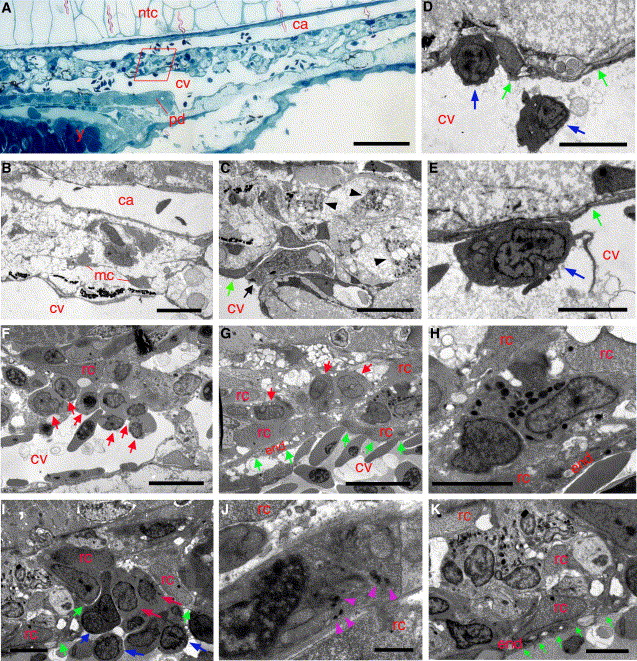
Fig. 3 Ultrastructure of the Caudal Hematopoietic Tissue (A–E) 2 dpf. (A) Light microscopy view of a longitudinal section through the CA and CV plexus (rostral left), close to the cloaca (end of pronephric duct (pd)); y, yolk sac. (B) EM view of area boxed in (A), showing mesenchymal cells (mc) in the space between CA and CV. (C) Macrophage in CV plexus lumen (arrow) and differentiated macrophages in the mesenchyme (arrowheads). (D and E) Early, lymphocyte-like hematopoietic precursors in the CV lumen. (F–K) 5 dpf. (F and G) Early presumptive myeloid/erythroid progenitors (red arrows) in the CV lumen (F) and in abluminal cell cords (G) within the meshwork of fibroblastic reticular cells (FRCs) (rc). (H–K) Granulopoiesis in abluminal mesenchyme; (H) eosinophil; (I) myeloblasts (red arrows) and an early precursor (blue arrow); (J) early neutrophilic myelocyte, containing a few, electron-dense cytoplasmic granules (arrowheads); (K) mature neutrophils between FRCs (rc). Note the intimate association between supporting FRCs (rc) and CV endothelium (“end,” and green arrows). Scale bars represent 100 μm in (A); 10 μm in (B), (C), (F), and (G); 5 μm in (D), (E), (H), (I), and (K); and 1 μm in (J).
Reprinted from Immunity, 25(6), Murayama, E., Kissa, K., Zapata, A., Mordelet, E., Briolat, V., Lin, H.F., Handin, R.I., and Herbomel, P., Tracing Hematopoietic Precursor Migration to Successive Hematopoietic Organs during Zebrafish Development, 963-975, Copyright (2006) with permission from Elsevier. Full text @ Immunity