
Image
|
Figure Caption
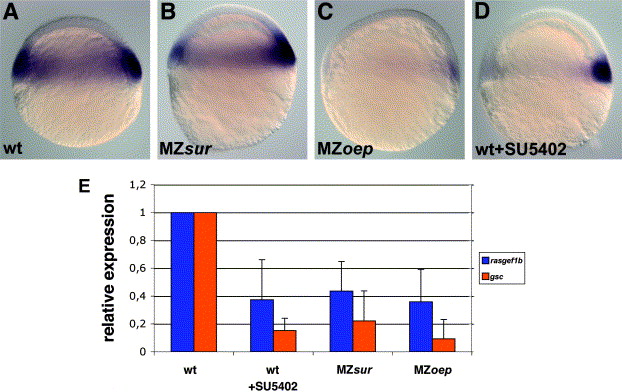
Fig. 5 rasgef1b is regulated by Nodal, FoxH1, and FGF signals. (A–D) Expression of rasgef1b in a wild type (wt) embryo (A), MZsur mutant (B), MZoep mutant (C) and a SU5402-treated embryo (D) at 50% epiboly stage. Embryos are shown from lateral with dorsal to the right. (E) Real-time PCR quantification of rasgef1b (in blue) and gsc (in red) expression in MZsur mutants, MZoep mutants and in embryos treated with SU5402 relative to the expression in wild type embryos.
Figure Data
Acknowledgments
This image is the copyrighted work of the attributed author or publisher, and
ZFIN has permission only to display this image to its users.
Additional permissions should be obtained from the applicable author or publisher of the image.
Reprinted from Gene expression patterns : GEP, 7(4), Epting, D., Vorwerk, S., Hageman, A., and Meyer, D., Expression of rasgef1b in zebrafish, 389-395, Copyright (2007) with permission from Elsevier. Full text @ Gene Expr. Patterns